. 2010 Aug;299(2):F369-79.
doi: 10.1152/ajprenal.00120.2010. Epub 2010 May 12.

Effect of intercalated cell-specific Rh C glycoprotein deletion on basal and metabolic acidosis-stimulated renal ammonia excretion

Affiliations

Effect of intercalated cell-specific Rh C glycoprotein deletion on basal and metabolic acidosis-stimulated renal ammonia excretion

Hyun-Wook Lee et al. Am J Physiol Renal Physiol. 2010 Aug.

Abstract

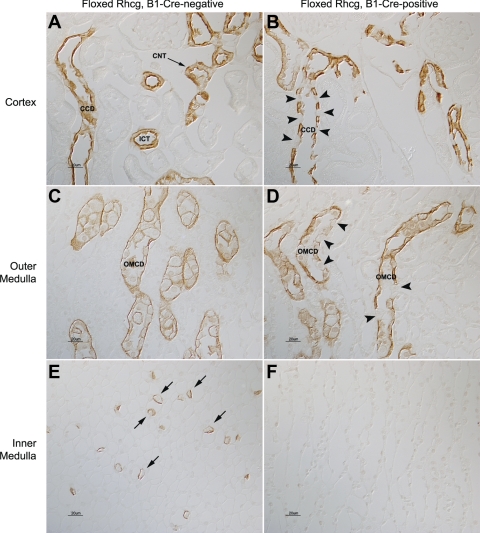
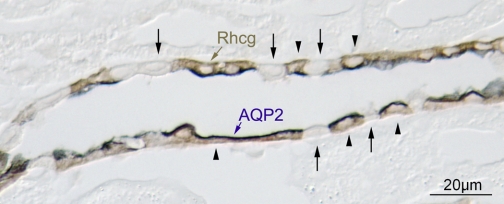
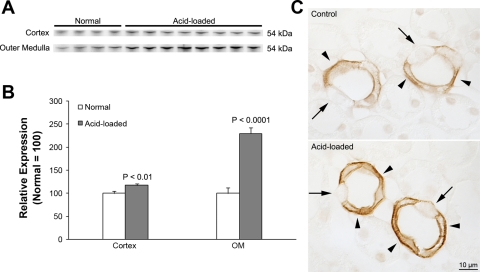
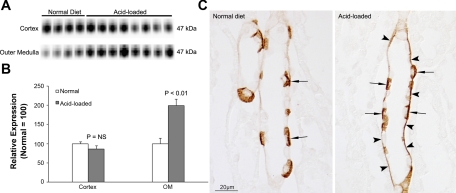
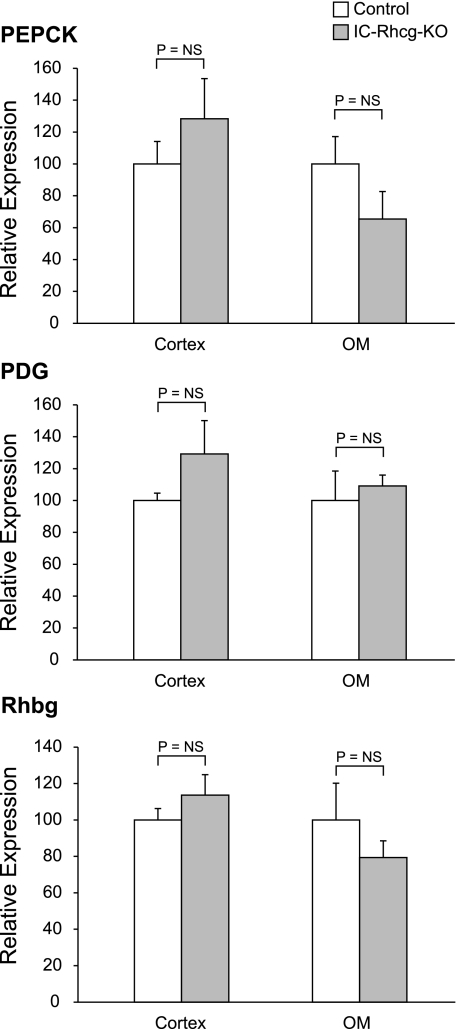
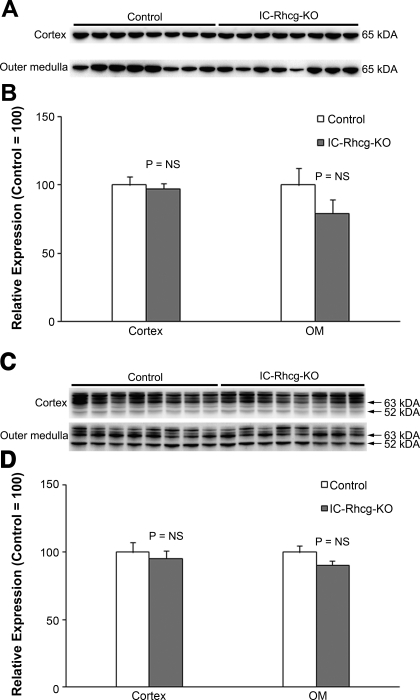
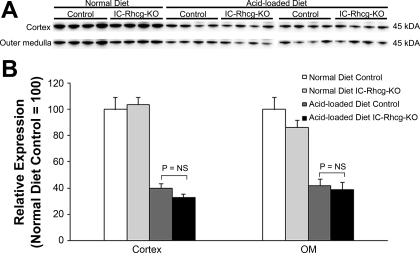
Rh C glycoprotein (Rhcg) is an NH(3)-specific transporter expressed in both intercalated cells (IC) and principal cells (PC) in the renal collecting duct. Recent studies show that deletion of Rhcg from both intercalated and principal cells inhibits both basal and acidosis-stimulated renal ammonia excretion. The purpose of the current studies was to better understand the specific role of Rhcg expression in intercalated cells in basal and metabolic acidosis-stimulated renal ammonia excretion. We generated mice with intercalated cell-specific Rhcg deletion (IC-Rhcg-KO) using Cre-loxP techniques; control (C) mice were floxed Rhcg but Cre negative. Under basal conditions, IC-Rhcg-KO and C mice excreted urine with similar ammonia content and pH. Mice were then acid loaded by adding HCl to their diet. Ammonia excretion after acid loading increased similarly in IC-Rhcg-KO and C mice during the first 2 days of acid loading but on day 3 was significantly less in IC-Rhcg-KO than in C mice. During the first 2 days of acid loading, urine was significantly more acidic in IC-Rhcg-KO mice than in C mice; there was no difference on day 3. In IC-Rhcg-KO mice, acid loading increased principal cell Rhcg expression in both the cortex and outer medulla as well as expression of another ammonia transporter, Rh glycoprotein B (Rhbg), in principal cells in the outer medulla. We conclude that 1) Rhcg expression in intercalated cells is necessary for the normal renal response to metabolic acidosis; 2) principal cell Rhcg contributes to both basal and acidosis-stimulated ammonia excretion; and 3) adaptations in Rhbg expression occur in response to acid-loading.


Figures

Fig. 1.
Fig. 1.
Rh glycoprotein C (Rhcg) immunolabel in floxed Rhcg, B1-Cre-negative, and floxed Rhcg, B1-Cre-positive mice. A: Rhcg immunolabel in cortex of floxed Rhcg, B1-Cre-negative mouse kidney. The normal apical and basolateral distribution of Rhcg immunolabel in cortical collecting duct (CCD) and in connecting tubule (CNT) and initial collecting tubule (ICT) is present. B: Rhcg immunolabel in floxed Rhcg, B1-Cre-positive mouse kidney. A large subpopulation of cells (arrowheads) has no detectable Rhcg in the CCD. The number of Rhcg-negative cells is greater than the expected number of B-type intercalated cells, a cell population which does not express detectable Rhcg immunolabel. C: Rhcg immunolabel in the outer medulla and demonstration of normal Rhcg expression in outer medullary collecting duct (OMCD) of B1-Cre-negative mouse kidney. D: outer medulla from floxed Rhcg, B1-Cre-positive mouse kidney. A subpopulation of cells in the OMCD (arrowheads) has no detectable Rhcg. E: Rhcg immunolabel in the inner medulla and demonstration of normal Rhcg expression in inner medullary collecting duct intercalated cells (arrows) in B1-Cre-negative mouse kidney. F: inner medulla from floxed Rhcg, B1-Cre-positive mouse kidney. No Rhcg immunolabel is detectable.
Fig. 2.
Fig. 2.
Double-immunolabeling of CCD with aquaporin-2 (AQP2) and Rhcg in floxed Rhcg, B1-Cre positive mice. Double-immunolabel for AQP2 (blue) and Rhcg (brown) was performed to identify the Rhcg-negative cells in floxed Rhcg, B1-Cre-positive mice. Principal cells, identified by apical AQP2 immunolabel, expressed Rhcg immunolabel (arrowheads). Intercalated cells, identified as AQP2-negative cells, did not express detectable Rhcg immunolabel (arrows).
Fig. 3.
Fig. 3.
Urinary ammonia excretion and urine pH in response to HCl-induced metabolic acidosis. A: urinary ammonia excretion. Acid loading increased urine ammonia excretion in both control (C) and intercalated cell (IC)-Rhcg-knockout (KO) mice. There was no significant difference in urinary ammonia excretion before acid loading, or on days 1 or 2 of acid loading between C and IC-Rhcg-KO mice. On day 3, total urine ammonia was significantly less in IC-Rhcg-KO mice than in C mice. B: urine pH in response to acid loading. After acid loading, IC-Rhcg-KO mice excreted significantly more acid urine than did in C mice on days 1 and 2. *P < 0.01 vs. C. **P < 0.05 vs. C.
Fig. 4.
Fig. 4.
Other effects of IC-Rhcg-KO. A: titratable acid excretion. There was no significant difference in titratable acid excretion between C and IC-Rhcg-KO mice, either under baseline conditions or in response to acid loading. B: net acid excretion. Net acid excretion did not differ significantly between C and IC-Rhcg-KO mice before acid loading or on days 1 or 2 of acid loading and was significantly less in IC-Rhcg-KO mice on day 3 of acid loading. C: dietary food intake. Food intake, and thus acid ingestion, did not differ significantly between C and IC-Rhcg-KO mice, either under baseline conditions or with acid loading. D: changes in body weight. Metabolic acidosis induces weight loss, but there were no significant differences in weight loss between C and IC-Rhcg-KO mice. E: urine volume. Urine volume did not differ significantly between C and IC-Rhcg-KO mice either before or during acid-loading; n = 8 at each time point in all graphs. P = not significant (NS).
Fig. 5.
Fig. 5.
Rhcg expression in IC-Rhcg-KO mice fed a normal and acid diet. A: immunoblot analysis of Rhcg expression in the cortex and outer medulla. Rhcg protein expression in IC-Rhbg-KO mice is increased by acid loading. B: quantification of Rhcg protein expression. Cortical and outer medullary Rhcg expression is significantly greater in acid-loaded than in normal diet IC-Rhcg-KO mice. C: Rhcg immunolabel in the OMCD of normal and acid-loaded diet IC-Rhcg-KO mice. Acid loading increases Rhcg immunolabel in OMCD principal cells (arrowheads) compared with IC-Rhcg-KO mice fed a normal diet. Intercalated cells (arrows) do not express significant Rhcg immunolabel. Values are means ± SE; n = 4, normal diet and n = 8, acid-loaded diet.
Fig. 6.
Fig. 6.
Double-immunolabel for Rhcg and H+-ATPase in acid-loaded mice. A and B: Rhcg immunolabel (brown) and H+-ATPase immunolabel (blue) in CCD of acid-loaded C and IC-Rhcg-KO mice, respectively. In C mice, abundant Rhcg immunolabel is present in both principal cells and type A intercalated cells (arrowheads). Type B intercalated cells, identified by basolateral H+-ATPase immunolabel (arrow), do not express detectable Rhcg immunolabel. In IC-Rhcg-KO mice, neither type A intercalated cells (arrowheads) nor type B intercalated cells (arrow) express Rhcg immunolabel. C and D: Rhcg immunolabel and H+-ATPase immunolabel in OMCD of acid-loaded C and IC-Rhcg-KO mice, respectively. In C mice, abundant Rhcg immunolabel is present in both principal cells and IC (arrowheads). IC-Rhcg-KO mice do not express Rhcg immunolabel in intercalated cells; principal cell Rhcg immunolabel is intact. E and F: Rhcg immunolabel and H+-ATPase immunolabel in IMCD of acid-loaded control and IC-Rhcg-KO mice, respectively. In C mice, abundant Rhcg immunolabel is present only in intercalated cells (arrowheads). IC-Rhcg-KO do not express Rhcg immunolabel in either intercalated cells (arrowheads) or in nonintercalated cells. G, glomerulus; P, proximal tubule.
Fig. 7.
Fig. 7.
Rhbg expression in IC-Rhcg-KO mice fed a normal and acid diet. A: immunoblot analysis of Rhbg expression in the cortex and outer medulla. B: quantification of Rhbg protein expression. Cortical Rhbg expression is not significantly different between IC-Rhcg-KO mice fed a normal and acid diet. In the outer medulla, Rhbg expression is significantly greater in acid-loaded than in normal-diet IC-Rhcg-KO mice. C: Rhbg immunolabel in the OMCD of normal-diet and acid-loaded IC-Rhcg-KO mice. Basolateral Rhbg immunolabel in OMCD principal cells (arrowheads) is increased in acid-loaded IC-Rhcg-KO mice relative to immunolabel in normal-diet IC-Rhcg-KO mice. Intercalated cell (arrows) basolateral Rhbg immunolabel appear unchanged.
Fig. 8.
Fig. 8.
Effect of IC-Rhcg-KO on phosphoenolpyruvate carboxykinase (PEPCK), phosphate-dependent glutaminase (PDG), and Rhbg expression in mice fed a normal diet. Rhbg, PEPCK, and PDG expression was quantified using immunodot analysis. A: PEPCK expression. IC-Rhcg-KO did not alter PEPCK expression in either the cortex or outer medulla (OM) in mice on a normal diet. B: PDG expression. IC-Rhcg-KO did not alter PDG expression in either the cortex or OM in mice on a normal diet. C: Rhbg expression. IC-Rhcg-KO did not alter Rhbg expression in either the cortex or OM in mice on a normal diet; n = 4/group.
Fig. 9.
Fig. 9.
PEPCK and PDG expression in acid-loaded IC-Rhcg-KO and C kidneys. A: immunoblot analysis of PEPCK expression in the cortex and OM of acid-loaded IC-Rhcg-KO and C mice. B: quantification of PEPCK protein expression. There was no significant difference in PEPCK expression between acid-loaded C and IC-Rhcg-KO mice in either the cortex or OM. C: immunoblot analysis of PDG expression in the cortex and OM of acid-loaded IC-Rhcg-KO and C mice. D: quantification of PDG protein expression. There was no significant difference in PDG expression between acid-loaded C and IC-Rhcg-KO mice in either the cortex or OM. Expression normalized to mean expression was equal to 100 in control mice in each region for each protein. Values are means ± SE; n = 8/group.
Fig. 10.
Fig. 10.
Glutamine synthetase (GS) expression in normal and acid-loaded IC-Rhcg-KO and C kidneys. A: immunoblot analysis of GS expression in the cortex and OM of IC-Rhcg-KO and C mice on a normal diet and when acid loaded. B: quantification of GS protein expression. GS expression did not differ significantly between C and IC-Rhcg-KO mice when on normal diet. Acid loading decreased GS expression compared with a normal diet, but there was no significant difference in GS expression in acid-loaded C and IC-Rhcg-KO mice in either the cortex or OM. Values are means ± SE; n = 4/group on a normal diet and n = 8/group on an acid-loaded diet. Results normalized to control mice on a normal diet was equal to 100.

Similar articles

Cited by

References

    1. Biver S, Belge H, Bourgeois S, Van Vooren P, Nowik M, Scohy S, Houillier P, Szpirer J, Szpirer C, Wagner CA, Devuyst O, Marini AM. A role for Rhesus factor Rhcg in renal ammonium excretion and male fertility. Nature 456: 339–343, 2008 - PubMed
    1. Brown ACN, Hallouane D, Mawby WJ, Karet FE, Saleem MA, Howie AJ, Toye AM. RhCG is the major putative ammonia transporter expressed in human kidney and RhBG is not expressed at detectable levels. Am J Physiol Renal Physiol 296: F1279–F1290, 2009 - PMC - PubMed
    1. Chambrey R, Goossens D, Bourgeois S, Picard N, Bloch-Faure M, Leviel F, Geoffroy V, Cambillau M, Colin Y, Paillard M, Houillier P, Cartron JP, Eladari D. Genetic ablation of Rhbg in mouse does not impair renal ammonium excretion. Am J Physiol Renal Physiol 289: F1281–F1290, 2005 - PubMed
    1. Conjard A, Komaty O, Delage H, Boghossian M, Martin M, Ferrier B, Baverel G. Inhibition of glutamine synthetase in the mouse kidney: a novel mechanism of adaptation to metabolic acidosis. J Biol Chem 278: 38159–38166, 2003 - PubMed
    1. Eladari D, Cheval L, Quentin F, Bertrand O, Mouro I, Cherif-Zahar B, Cartron JP, Paillard M, Doucet A, Chambrey R. Expression of RhCG, a new putative NH3/NH4+ transporter, along the rat nephron. J Am Soc Nephrol 13: 1999–2008, 2002 - PubMed

Publication types

MeSH terms

LinkOut - more resources