. 2010 May;30(3):751-61.
doi: 10.1148/rg.303095756.

MR imaging of deltoid ligament pathologic findings and associated impingement syndromes

Affiliations

MR imaging of deltoid ligament pathologic findings and associated impingement syndromes

Avneesh Chhabra et al. Radiographics. 2010 May.

Abstract

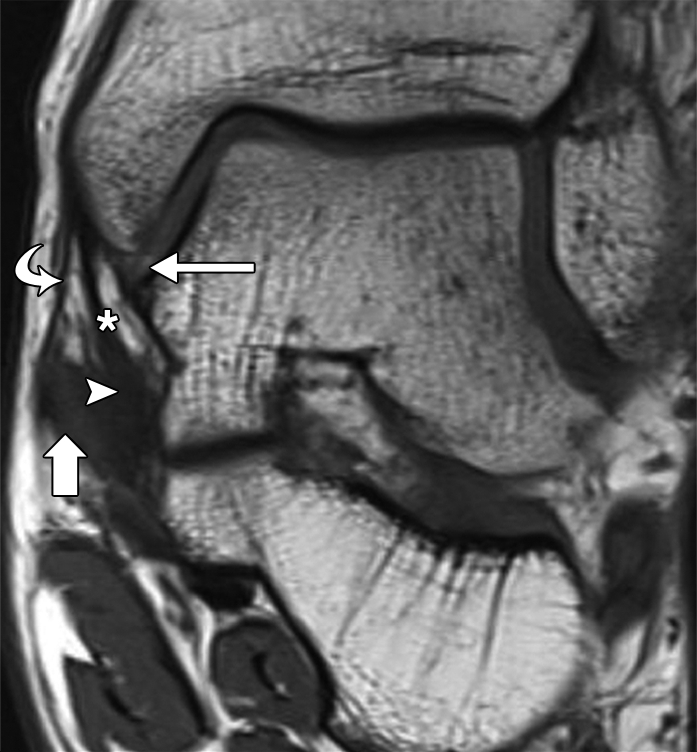
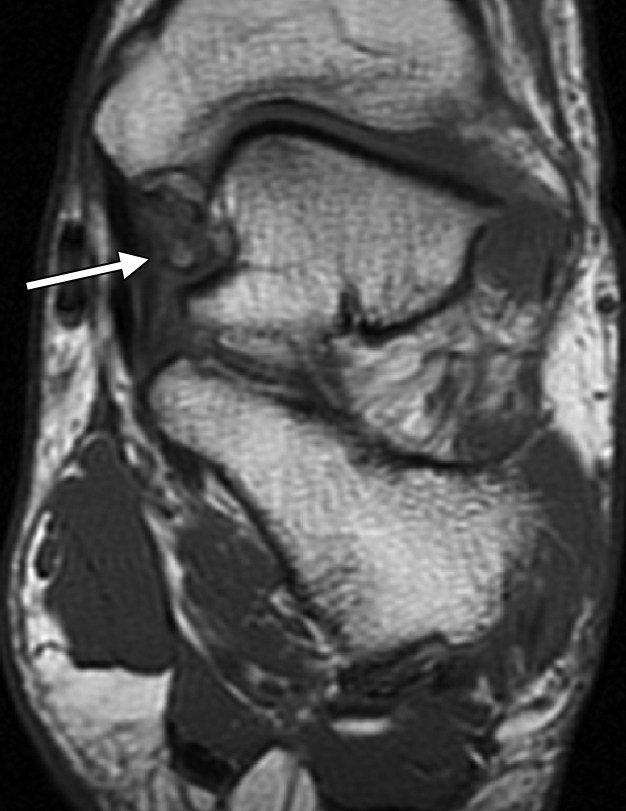
Injuries of the deltoid ligament of the ankle are increasingly recognized with the widespread use of magnetic resonance (MR) imaging. The use of higher magnetic field strengths requires familiarity with the anatomic substructure of the deltoid ligament to better localize and characterize pathologic findings. Specifically, improved image resolution allows components of the superficial (tibiocalcaneal, tibionavicular, posterior superficial tibiotalar, and tibiospring ligaments) and deep (anterior tibiotalar and posterior deep tibiotalar ligaments) portions of the ligament to be evaluated separately. Awareness of the deltoid ligament substructure and associated injury patterns can guide the radiologist in defining underlying mechanical derangement, such as that seen in various impingement disorders. In this review article, the MR imaging technique for the deltoid ligament is summarized, and the normal and abnormal MR imaging appearances of various components of the deltoid ligament and associated impingement syndromes are presented.


Figures

Figure 1a
Figure 1a
Normal deltoid ligament. (a) Coronal T1-weighted MR image shows a normal PDTL (arrow) with a striated appearance. (b) Coronal T1-weighted MR image shows a normal ATTL (thin arrow), tibiospring ligament (*), flexor retinaculum (curved arrow), tibialis posterior tendon (thick arrow), and superomedial oblique band (arrowhead). (c) Axial T1-weighted MR image shows the normal ATTL (arrow) and PDTL (arrowhead).
Figure 1b
Figure 1b
Normal deltoid ligament. (a) Coronal T1-weighted MR image shows a normal PDTL (arrow) with a striated appearance. (b) Coronal T1-weighted MR image shows a normal ATTL (thin arrow), tibiospring ligament (*), flexor retinaculum (curved arrow), tibialis posterior tendon (thick arrow), and superomedial oblique band (arrowhead). (c) Axial T1-weighted MR image shows the normal ATTL (arrow) and PDTL (arrowhead).
Figure 1c
Figure 1c
Normal deltoid ligament. (a) Coronal T1-weighted MR image shows a normal PDTL (arrow) with a striated appearance. (b) Coronal T1-weighted MR image shows a normal ATTL (thin arrow), tibiospring ligament (*), flexor retinaculum (curved arrow), tibialis posterior tendon (thick arrow), and superomedial oblique band (arrowhead). (c) Axial T1-weighted MR image shows the normal ATTL (arrow) and PDTL (arrowhead).
Figure 2a
Figure 2a
Normal deltoid ligament. (a) Coronal intermediate-weighted fat-saturated MR image shows a normal ATTL with a minimal striated appearance caused by fat suppression (straight arrow), tibiocalcaneal ligament (curved arrow), and flexor retinaculum (arrowhead). (b) Coronal intermediate-weighted fat-saturated MR image shows a normal PDTL (arrow) with a striated appearance and the flexor retinaculum (arrowhead). (c) Coronal intermediate-weighted fat-saturated MR image shows the tibiospring ligament (*), flexor retinaculum (curved arrow), tibialis posterior tendon (thick arrow), superomedial oblique band (arrowhead), and fibrocartilaginous gliding zone (thin arrow).
Figure 2b
Figure 2b
Normal deltoid ligament. (a) Coronal intermediate-weighted fat-saturated MR image shows a normal ATTL with a minimal striated appearance caused by fat suppression (straight arrow), tibiocalcaneal ligament (curved arrow), and flexor retinaculum (arrowhead). (b) Coronal intermediate-weighted fat-saturated MR image shows a normal PDTL (arrow) with a striated appearance and the flexor retinaculum (arrowhead). (c) Coronal intermediate-weighted fat-saturated MR image shows the tibiospring ligament (*), flexor retinaculum (curved arrow), tibialis posterior tendon (thick arrow), superomedial oblique band (arrowhead), and fibrocartilaginous gliding zone (thin arrow).
Figure 2c
Figure 2c
Normal deltoid ligament. (a) Coronal intermediate-weighted fat-saturated MR image shows a normal ATTL with a minimal striated appearance caused by fat suppression (straight arrow), tibiocalcaneal ligament (curved arrow), and flexor retinaculum (arrowhead). (b) Coronal intermediate-weighted fat-saturated MR image shows a normal PDTL (arrow) with a striated appearance and the flexor retinaculum (arrowhead). (c) Coronal intermediate-weighted fat-saturated MR image shows the tibiospring ligament (*), flexor retinaculum (curved arrow), tibialis posterior tendon (thick arrow), superomedial oblique band (arrowhead), and fibrocartilaginous gliding zone (thin arrow).
Figure 3a
Figure 3a
Acute left ankle injury and medial pain in a 45-year-old man. (a) Coronal intermediate-weighted MR image shows loss of fatty striations of the PDTL (arrow), consistent with a grade I sprain injury. (b) Coronal intermediate-weighted fat-saturated MR image shows a medial malleolar contusion and minimal hyperintensity of the PDTL (arrow). Note the grade I/II sprained tibiocalcaneal ligament (arrowhead). (c) Axial intermediate-weighted MR image shows amorphous signal intensity of both the ATTL (arrowhead) and the PDTL (arrow), in keeping with a grade I sprain.
Figure 3b
Figure 3b
Acute left ankle injury and medial pain in a 45-year-old man. (a) Coronal intermediate-weighted MR image shows loss of fatty striations of the PDTL (arrow), consistent with a grade I sprain injury. (b) Coronal intermediate-weighted fat-saturated MR image shows a medial malleolar contusion and minimal hyperintensity of the PDTL (arrow). Note the grade I/II sprained tibiocalcaneal ligament (arrowhead). (c) Axial intermediate-weighted MR image shows amorphous signal intensity of both the ATTL (arrowhead) and the PDTL (arrow), in keeping with a grade I sprain.
Figure 3c
Figure 3c
Acute left ankle injury and medial pain in a 45-year-old man. (a) Coronal intermediate-weighted MR image shows loss of fatty striations of the PDTL (arrow), consistent with a grade I sprain injury. (b) Coronal intermediate-weighted fat-saturated MR image shows a medial malleolar contusion and minimal hyperintensity of the PDTL (arrow). Note the grade I/II sprained tibiocalcaneal ligament (arrowhead). (c) Axial intermediate-weighted MR image shows amorphous signal intensity of both the ATTL (arrowhead) and the PDTL (arrow), in keeping with a grade I sprain.
Figure 4a
Figure 4a
Images of a 55-year-old woman with a history of subacute ankle injury. (a) Coronal T2-weighted fat-saturated MR image shows a small osteochondral lesion of the lateral talar dome (arrow) and a grade I/II sprain of the PDTL (arrowhead). (b) Sagittal T2-weighted fat-saturated MR image shows abnormal high signal intensity in the PDTL (arrow).
Figure 4b
Figure 4b
Images of a 55-year-old woman with a history of subacute ankle injury. (a) Coronal T2-weighted fat-saturated MR image shows a small osteochondral lesion of the lateral talar dome (arrow) and a grade I/II sprain of the PDTL (arrowhead). (b) Sagittal T2-weighted fat-saturated MR image shows abnormal high signal intensity in the PDTL (arrow).
Figure 5a
Figure 5a
Acute ankle injury. (a) Coronal T1-weighted MR image shows amorphous signal intensity in the ATTL (curved arrow) and subcutaneous edema, most prominent medially (straight arrow). (b) Coronal T2-weighted fat-saturated MR image again shows subcutaneous edema (straight arrow), a grade I sprain of the ATTL (curved arrow), and a grade II sprained hypointense tibiospring ligament (arrowhead).
Figure 5b
Figure 5b
Acute ankle injury. (a) Coronal T1-weighted MR image shows amorphous signal intensity in the ATTL (curved arrow) and subcutaneous edema, most prominent medially (straight arrow). (b) Coronal T2-weighted fat-saturated MR image again shows subcutaneous edema (straight arrow), a grade I sprain of the ATTL (curved arrow), and a grade II sprained hypointense tibiospring ligament (arrowhead).
Figure 6a
Figure 6a
Images of a 37-year-old man with ankle pain. (a) Coronal T2-weighted fat-saturated MR image shows a hypointense tibiospring ligament (arrow) and superomedial oblique band (arrowhead). (b) Coronal T1-weighted MR image shows the hypointense tibiospring ligament (arrow) and superomedial oblique band (arrowhead). (c) Axial T2-weighted fat-saturated MR image shows the hypointense tibiospring ligament (arrow).
Figure 6b
Figure 6b
Images of a 37-year-old man with ankle pain. (a) Coronal T2-weighted fat-saturated MR image shows a hypointense tibiospring ligament (arrow) and superomedial oblique band (arrowhead). (b) Coronal T1-weighted MR image shows the hypointense tibiospring ligament (arrow) and superomedial oblique band (arrowhead). (c) Axial T2-weighted fat-saturated MR image shows the hypointense tibiospring ligament (arrow).
Figure 6c
Figure 6c
Images of a 37-year-old man with ankle pain. (a) Coronal T2-weighted fat-saturated MR image shows a hypointense tibiospring ligament (arrow) and superomedial oblique band (arrowhead). (b) Coronal T1-weighted MR image shows the hypointense tibiospring ligament (arrow) and superomedial oblique band (arrowhead). (c) Axial T2-weighted fat-saturated MR image shows the hypointense tibiospring ligament (arrow).
Figure 7a
Figure 7a
Acute left ankle injury with grade II deltoid ligament sprain. (a) Coronal T1-weighted MR image shows loss of normal striations in the deep deltoid ligament (arrow). (b) Coronal T2-weighted fat-saturated MR image helps confirm a grade II tear of the ATTL (short thin arrow), calcaneofibular ligament tear (thick straight arrow), anterior talofibular ligament tear (arrowhead), medial malleolar contusion (long thin arrow), and talar contusion (curved arrow). (c) Axial T1-weighted MR image shows thickening and loss of striations of the deep deltoid ligament (arrow). (d) Axial T2-weighted fat-saturated MR image shows a grade II deep deltoid ligament tear (arrow) and anterior talofibular ligament tear (arrowhead).
Figure 7b
Figure 7b
Acute left ankle injury with grade II deltoid ligament sprain. (a) Coronal T1-weighted MR image shows loss of normal striations in the deep deltoid ligament (arrow). (b) Coronal T2-weighted fat-saturated MR image helps confirm a grade II tear of the ATTL (short thin arrow), calcaneofibular ligament tear (thick straight arrow), anterior talofibular ligament tear (arrowhead), medial malleolar contusion (long thin arrow), and talar contusion (curved arrow). (c) Axial T1-weighted MR image shows thickening and loss of striations of the deep deltoid ligament (arrow). (d) Axial T2-weighted fat-saturated MR image shows a grade II deep deltoid ligament tear (arrow) and anterior talofibular ligament tear (arrowhead).
Figure 7c
Figure 7c
Acute left ankle injury with grade II deltoid ligament sprain. (a) Coronal T1-weighted MR image shows loss of normal striations in the deep deltoid ligament (arrow). (b) Coronal T2-weighted fat-saturated MR image helps confirm a grade II tear of the ATTL (short thin arrow), calcaneofibular ligament tear (thick straight arrow), anterior talofibular ligament tear (arrowhead), medial malleolar contusion (long thin arrow), and talar contusion (curved arrow). (c) Axial T1-weighted MR image shows thickening and loss of striations of the deep deltoid ligament (arrow). (d) Axial T2-weighted fat-saturated MR image shows a grade II deep deltoid ligament tear (arrow) and anterior talofibular ligament tear (arrowhead).
Figure 7d
Figure 7d
Acute left ankle injury with grade II deltoid ligament sprain. (a) Coronal T1-weighted MR image shows loss of normal striations in the deep deltoid ligament (arrow). (b) Coronal T2-weighted fat-saturated MR image helps confirm a grade II tear of the ATTL (short thin arrow), calcaneofibular ligament tear (thick straight arrow), anterior talofibular ligament tear (arrowhead), medial malleolar contusion (long thin arrow), and talar contusion (curved arrow). (c) Axial T1-weighted MR image shows thickening and loss of striations of the deep deltoid ligament (arrow). (d) Axial T2-weighted fat-saturated MR image shows a grade II deep deltoid ligament tear (arrow) and anterior talofibular ligament tear (arrowhead).
Figure 8a
Figure 8a
Images of a 55-year-old man with chronic ankle pain. (a) Coronal intermediate-weighted MR image shows posterolateral talar subluxation and tilt, with tibiotalar spurs in the medial clear space (arrow). (b) Coronal intermediate-weighted fat-saturated MR image shows tibiotalar osteoarthritis with subchondral edema (circled area). Also note amorphous signal intensity of the ATTL (arrowhead). (c) Coronal intermediate-weighted fat-saturated MR image obtained posterior to b shows thickened and remodeled tibiocalcaneal ligament (arrow) related to the chronic/old injury.
Figure 8b
Figure 8b
Images of a 55-year-old man with chronic ankle pain. (a) Coronal intermediate-weighted MR image shows posterolateral talar subluxation and tilt, with tibiotalar spurs in the medial clear space (arrow). (b) Coronal intermediate-weighted fat-saturated MR image shows tibiotalar osteoarthritis with subchondral edema (circled area). Also note amorphous signal intensity of the ATTL (arrowhead). (c) Coronal intermediate-weighted fat-saturated MR image obtained posterior to b shows thickened and remodeled tibiocalcaneal ligament (arrow) related to the chronic/old injury.
Figure 8c
Figure 8c
Images of a 55-year-old man with chronic ankle pain. (a) Coronal intermediate-weighted MR image shows posterolateral talar subluxation and tilt, with tibiotalar spurs in the medial clear space (arrow). (b) Coronal intermediate-weighted fat-saturated MR image shows tibiotalar osteoarthritis with subchondral edema (circled area). Also note amorphous signal intensity of the ATTL (arrowhead). (c) Coronal intermediate-weighted fat-saturated MR image obtained posterior to b shows thickened and remodeled tibiocalcaneal ligament (arrow) related to the chronic/old injury.
Figure 9a
Figure 9a
Images of a 45-year-old woman with medial ankle pain and findings of an old partial tear of the deltoid ligament and tibialis posterior dysfunction. (a) Coronal intermediate-weighted MR image shows amorphous signal intensity in the ATTL (arrow). (b) Coronal intermediate-weighted fat-saturated MR image shows amorphous signal intensity of the ATTL (straight arrow) and a mildly thickened tibiospring ligament (curved arrow) and superomedial oblique band (arrowhead). (c) Sagittal intermediate-weighted MR image shows amorphous signal intensity of the ATTL (arrow) and PDTL (arrowhead). (d) Axial intermediate-weighted fat-saturated MR image shows a thickened tibialis posterior tendon with mild tenosynovitis (arrowhead) and a hypointense anterior talofibular ligament related to an old partial tear (arrow).
Figure 9b
Figure 9b
Images of a 45-year-old woman with medial ankle pain and findings of an old partial tear of the deltoid ligament and tibialis posterior dysfunction. (a) Coronal intermediate-weighted MR image shows amorphous signal intensity in the ATTL (arrow). (b) Coronal intermediate-weighted fat-saturated MR image shows amorphous signal intensity of the ATTL (straight arrow) and a mildly thickened tibiospring ligament (curved arrow) and superomedial oblique band (arrowhead). (c) Sagittal intermediate-weighted MR image shows amorphous signal intensity of the ATTL (arrow) and PDTL (arrowhead). (d) Axial intermediate-weighted fat-saturated MR image shows a thickened tibialis posterior tendon with mild tenosynovitis (arrowhead) and a hypointense anterior talofibular ligament related to an old partial tear (arrow).
Figure 9c
Figure 9c
Images of a 45-year-old woman with medial ankle pain and findings of an old partial tear of the deltoid ligament and tibialis posterior dysfunction. (a) Coronal intermediate-weighted MR image shows amorphous signal intensity in the ATTL (arrow). (b) Coronal intermediate-weighted fat-saturated MR image shows amorphous signal intensity of the ATTL (straight arrow) and a mildly thickened tibiospring ligament (curved arrow) and superomedial oblique band (arrowhead). (c) Sagittal intermediate-weighted MR image shows amorphous signal intensity of the ATTL (arrow) and PDTL (arrowhead). (d) Axial intermediate-weighted fat-saturated MR image shows a thickened tibialis posterior tendon with mild tenosynovitis (arrowhead) and a hypointense anterior talofibular ligament related to an old partial tear (arrow).
Figure 9d
Figure 9d
Images of a 45-year-old woman with medial ankle pain and findings of an old partial tear of the deltoid ligament and tibialis posterior dysfunction. (a) Coronal intermediate-weighted MR image shows amorphous signal intensity in the ATTL (arrow). (b) Coronal intermediate-weighted fat-saturated MR image shows amorphous signal intensity of the ATTL (straight arrow) and a mildly thickened tibiospring ligament (curved arrow) and superomedial oblique band (arrowhead). (c) Sagittal intermediate-weighted MR image shows amorphous signal intensity of the ATTL (arrow) and PDTL (arrowhead). (d) Axial intermediate-weighted fat-saturated MR image shows a thickened tibialis posterior tendon with mild tenosynovitis (arrowhead) and a hypointense anterior talofibular ligament related to an old partial tear (arrow).
Figure 10a
Figure 10a
Anteromedial ankle impingement in a 55-year-old woman with previous ankle injuries and recurrent medial ankle pain. (a) Coronal intermediate-weighted MR image shows amorphous signal intensity in the ATTL with heterotopic bone formation (arrow). (b) Coronal intermediate-weighted fat-saturated MR image shows amorphous signal intensity in the ATTL and heterotopic bone formation (arrow). (c) Axial T1-weighted MR image helps confirm involvement of the ATTL (arrow) and shows a normal-appearing PDTL (arrowhead). (d) Axial intermediate-weighted fat-saturated MR image shows fibrosis and synovial proliferation of the ATTL (arrow).
Figure 10b
Figure 10b
Anteromedial ankle impingement in a 55-year-old woman with previous ankle injuries and recurrent medial ankle pain. (a) Coronal intermediate-weighted MR image shows amorphous signal intensity in the ATTL with heterotopic bone formation (arrow). (b) Coronal intermediate-weighted fat-saturated MR image shows amorphous signal intensity in the ATTL and heterotopic bone formation (arrow). (c) Axial T1-weighted MR image helps confirm involvement of the ATTL (arrow) and shows a normal-appearing PDTL (arrowhead). (d) Axial intermediate-weighted fat-saturated MR image shows fibrosis and synovial proliferation of the ATTL (arrow).
Figure 10c
Figure 10c
Anteromedial ankle impingement in a 55-year-old woman with previous ankle injuries and recurrent medial ankle pain. (a) Coronal intermediate-weighted MR image shows amorphous signal intensity in the ATTL with heterotopic bone formation (arrow). (b) Coronal intermediate-weighted fat-saturated MR image shows amorphous signal intensity in the ATTL and heterotopic bone formation (arrow). (c) Axial T1-weighted MR image helps confirm involvement of the ATTL (arrow) and shows a normal-appearing PDTL (arrowhead). (d) Axial intermediate-weighted fat-saturated MR image shows fibrosis and synovial proliferation of the ATTL (arrow).
Figure 10d
Figure 10d
Anteromedial ankle impingement in a 55-year-old woman with previous ankle injuries and recurrent medial ankle pain. (a) Coronal intermediate-weighted MR image shows amorphous signal intensity in the ATTL with heterotopic bone formation (arrow). (b) Coronal intermediate-weighted fat-saturated MR image shows amorphous signal intensity in the ATTL and heterotopic bone formation (arrow). (c) Axial T1-weighted MR image helps confirm involvement of the ATTL (arrow) and shows a normal-appearing PDTL (arrowhead). (d) Axial intermediate-weighted fat-saturated MR image shows fibrosis and synovial proliferation of the ATTL (arrow).
Figure 11a
Figure 11a
Predominantly anteromedial impingement in a 39-year-old man with recalcitrant medial ankle pain and instability. (a) Anteroposterior radiograph of the ankle shows heterotopic bone formation (arrow) in the medial tibiotalar space. (b) Coronal intermediate-weighted MR image shows heterotopic bone formation in relation to the ATTL (arrow), with amorphous signal intensity. (c) Coronal T2-weighted fat-saturated MR image shows abnormal high signal intensity (arrow) in the region of the ATTL that is due to synovial proliferation and fibrosis. (d) Axial intermediate-weighted MR image shows amorphous signal intensity in both the ATTL and the PDTL, with heterotopic bone formation (arrow) in relation to the ATTL.
Figure 11b
Figure 11b
Predominantly anteromedial impingement in a 39-year-old man with recalcitrant medial ankle pain and instability. (a) Anteroposterior radiograph of the ankle shows heterotopic bone formation (arrow) in the medial tibiotalar space. (b) Coronal intermediate-weighted MR image shows heterotopic bone formation in relation to the ATTL (arrow), with amorphous signal intensity. (c) Coronal T2-weighted fat-saturated MR image shows abnormal high signal intensity (arrow) in the region of the ATTL that is due to synovial proliferation and fibrosis. (d) Axial intermediate-weighted MR image shows amorphous signal intensity in both the ATTL and the PDTL, with heterotopic bone formation (arrow) in relation to the ATTL.
Figure 11c
Figure 11c
Predominantly anteromedial impingement in a 39-year-old man with recalcitrant medial ankle pain and instability. (a) Anteroposterior radiograph of the ankle shows heterotopic bone formation (arrow) in the medial tibiotalar space. (b) Coronal intermediate-weighted MR image shows heterotopic bone formation in relation to the ATTL (arrow), with amorphous signal intensity. (c) Coronal T2-weighted fat-saturated MR image shows abnormal high signal intensity (arrow) in the region of the ATTL that is due to synovial proliferation and fibrosis. (d) Axial intermediate-weighted MR image shows amorphous signal intensity in both the ATTL and the PDTL, with heterotopic bone formation (arrow) in relation to the ATTL.
Figure 11d
Figure 11d
Predominantly anteromedial impingement in a 39-year-old man with recalcitrant medial ankle pain and instability. (a) Anteroposterior radiograph of the ankle shows heterotopic bone formation (arrow) in the medial tibiotalar space. (b) Coronal intermediate-weighted MR image shows heterotopic bone formation in relation to the ATTL (arrow), with amorphous signal intensity. (c) Coronal T2-weighted fat-saturated MR image shows abnormal high signal intensity (arrow) in the region of the ATTL that is due to synovial proliferation and fibrosis. (d) Axial intermediate-weighted MR image shows amorphous signal intensity in both the ATTL and the PDTL, with heterotopic bone formation (arrow) in relation to the ATTL.
Figure 12a
Figure 12a
Posteromedial impingement in a 46-year-old man with previous ankle injury and posteromedial pain. (a) Coronal intermediate-weighted MR image shows a normal striated appearance of the ATTL (arrow). (b) Axial intermediate-weighted MR image shows amorphous signal intensity in the PDTL, with heterotopic bone formation in the posterior and central medial clear space (thin arrow). Also note the osteochondral lesion of the posterior medial talus (thick arrow). (c) Axial intermediate-weighted fat-saturated MR image shows amorphous signal intensity in the PDTL (thin arrow) and the osteochondral lesion of the posterior medial talus (thick arrow). (d) Axial intermediate-weighted MR image obtained caudad to b shows similar findings: amorphous signal intensity in the PDTL and heterotopic bone formation in the medial clear space (arrow). (e) Axial intermediate-weighted fat-saturated MR image obtained caudad to c shows abnormal high signal intensity in the PDTL (arrow), resulting from synovial proliferation and fibrocartilaginous metaplasia.
Figure 12b
Figure 12b
Posteromedial impingement in a 46-year-old man with previous ankle injury and posteromedial pain. (a) Coronal intermediate-weighted MR image shows a normal striated appearance of the ATTL (arrow). (b) Axial intermediate-weighted MR image shows amorphous signal intensity in the PDTL, with heterotopic bone formation in the posterior and central medial clear space (thin arrow). Also note the osteochondral lesion of the posterior medial talus (thick arrow). (c) Axial intermediate-weighted fat-saturated MR image shows amorphous signal intensity in the PDTL (thin arrow) and the osteochondral lesion of the posterior medial talus (thick arrow). (d) Axial intermediate-weighted MR image obtained caudad to b shows similar findings: amorphous signal intensity in the PDTL and heterotopic bone formation in the medial clear space (arrow). (e) Axial intermediate-weighted fat-saturated MR image obtained caudad to c shows abnormal high signal intensity in the PDTL (arrow), resulting from synovial proliferation and fibrocartilaginous metaplasia.
Figure 12c
Figure 12c
Posteromedial impingement in a 46-year-old man with previous ankle injury and posteromedial pain. (a) Coronal intermediate-weighted MR image shows a normal striated appearance of the ATTL (arrow). (b) Axial intermediate-weighted MR image shows amorphous signal intensity in the PDTL, with heterotopic bone formation in the posterior and central medial clear space (thin arrow). Also note the osteochondral lesion of the posterior medial talus (thick arrow). (c) Axial intermediate-weighted fat-saturated MR image shows amorphous signal intensity in the PDTL (thin arrow) and the osteochondral lesion of the posterior medial talus (thick arrow). (d) Axial intermediate-weighted MR image obtained caudad to b shows similar findings: amorphous signal intensity in the PDTL and heterotopic bone formation in the medial clear space (arrow). (e) Axial intermediate-weighted fat-saturated MR image obtained caudad to c shows abnormal high signal intensity in the PDTL (arrow), resulting from synovial proliferation and fibrocartilaginous metaplasia.
Figure 12d
Figure 12d
Posteromedial impingement in a 46-year-old man with previous ankle injury and posteromedial pain. (a) Coronal intermediate-weighted MR image shows a normal striated appearance of the ATTL (arrow). (b) Axial intermediate-weighted MR image shows amorphous signal intensity in the PDTL, with heterotopic bone formation in the posterior and central medial clear space (thin arrow). Also note the osteochondral lesion of the posterior medial talus (thick arrow). (c) Axial intermediate-weighted fat-saturated MR image shows amorphous signal intensity in the PDTL (thin arrow) and the osteochondral lesion of the posterior medial talus (thick arrow). (d) Axial intermediate-weighted MR image obtained caudad to b shows similar findings: amorphous signal intensity in the PDTL and heterotopic bone formation in the medial clear space (arrow). (e) Axial intermediate-weighted fat-saturated MR image obtained caudad to c shows abnormal high signal intensity in the PDTL (arrow), resulting from synovial proliferation and fibrocartilaginous metaplasia.
Figure 12e
Figure 12e
Posteromedial impingement in a 46-year-old man with previous ankle injury and posteromedial pain. (a) Coronal intermediate-weighted MR image shows a normal striated appearance of the ATTL (arrow). (b) Axial intermediate-weighted MR image shows amorphous signal intensity in the PDTL, with heterotopic bone formation in the posterior and central medial clear space (thin arrow). Also note the osteochondral lesion of the posterior medial talus (thick arrow). (c) Axial intermediate-weighted fat-saturated MR image shows amorphous signal intensity in the PDTL (thin arrow) and the osteochondral lesion of the posterior medial talus (thick arrow). (d) Axial intermediate-weighted MR image obtained caudad to b shows similar findings: amorphous signal intensity in the PDTL and heterotopic bone formation in the medial clear space (arrow). (e) Axial intermediate-weighted fat-saturated MR image obtained caudad to c shows abnormal high signal intensity in the PDTL (arrow), resulting from synovial proliferation and fibrocartilaginous metaplasia.

References

    1. Muhle C, Frank LR, Rand T, et al. Collateral ligaments of the ankle: high-resolution MR imaging with a local gradient coil and anatomic correlation in cadavers. RadioGraphics 1999;19(3):673–683 - PubMed
    1. Stoller DW.Magnetic resonance imaging in orthopaedics and sports medicine 3rd ed.Baltimore, Md: Lippincott Williams & Wilkins, 2006; 786–793
    1. Pankovich AM, Shivaram MS.Anatomical basis of variability in injuries of the medial malleolus and the deltoid ligament. I. Anatomical studies. Acta Orthop Scand 1979;50(2):217–223 - PubMed
    1. Klein MA.MR imaging of the ankle: normal and abnormal findings in the medial collateral ligament. AJR Am J Roentgenol 1994;162(2):377–383 - PubMed
    1. Hintermann B.Biomechanics of the unstable ankle joint and clinical implications. Med Sci Sports Exerc 1999;31(suppl 7):S459–S469 - PubMed

Publication types

MeSH terms