. 2010 Jul 16;285(29):22414-25.
doi: 10.1074/jbc.M110.120121. Epub 2010 May 12.

Protein kinase C isoforms zeta and iota mediate collagenase expression and cartilage destruction via STAT3- and ERK-dependent c-fos induction

Affiliations

Protein kinase C isoforms zeta and iota mediate collagenase expression and cartilage destruction via STAT3- and ERK-dependent c-fos induction

Gary J Litherland et al. J Biol Chem. .

Abstract

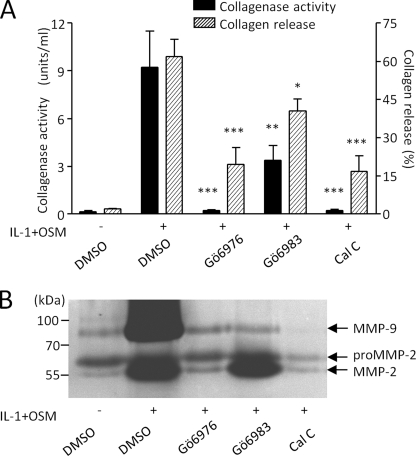
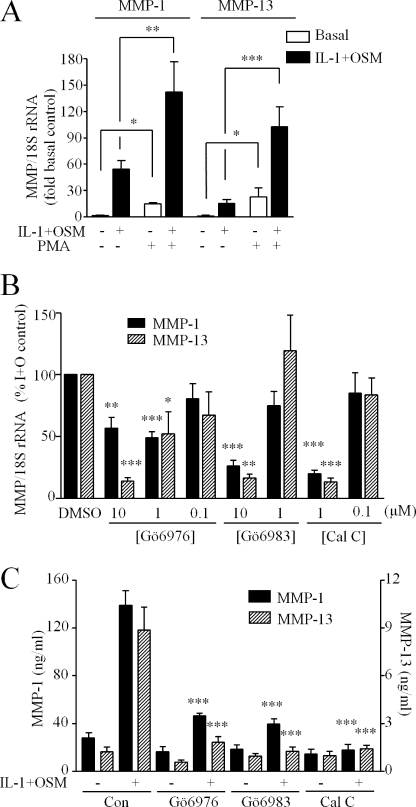
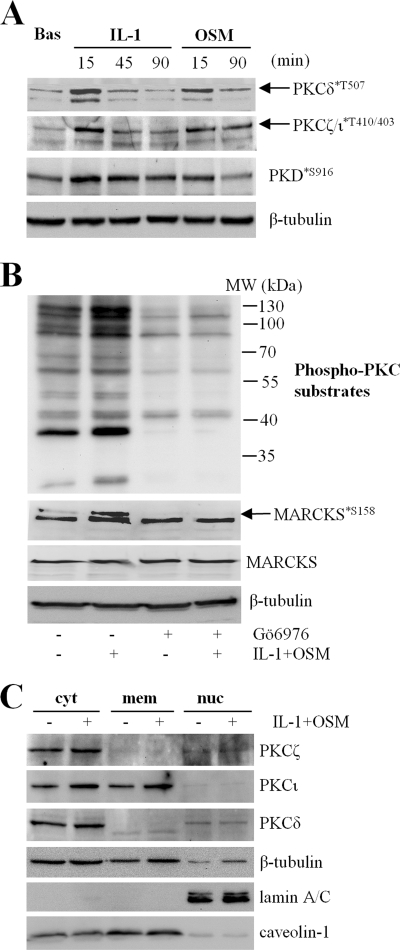
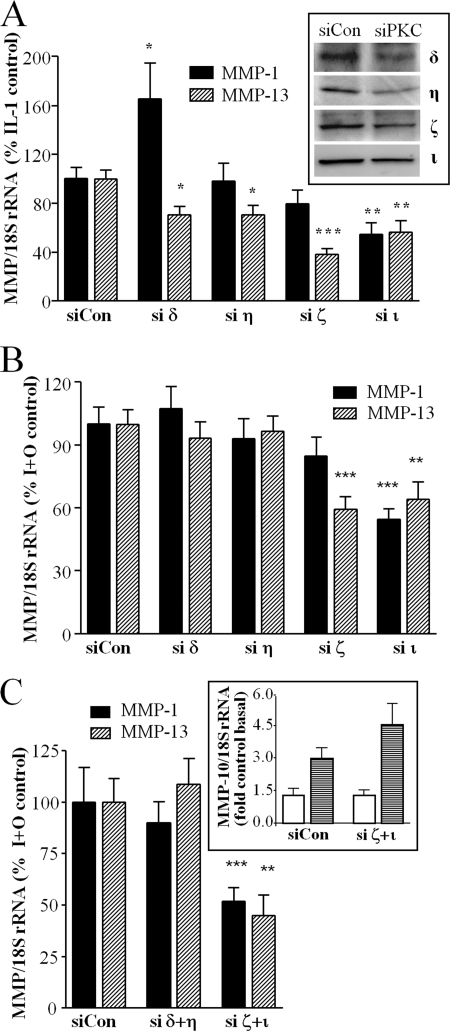
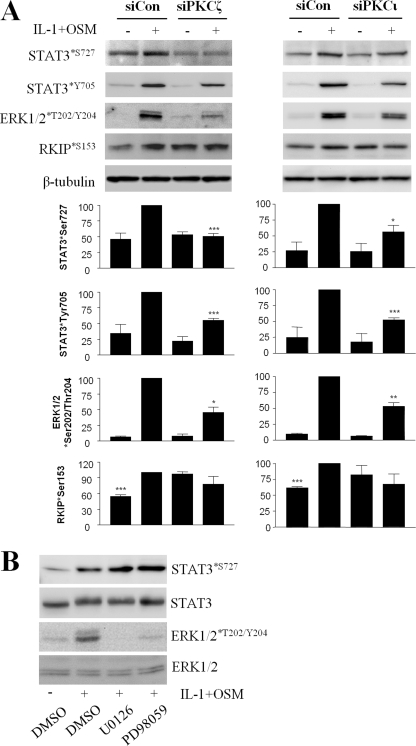
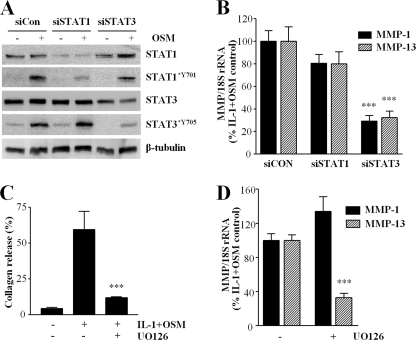
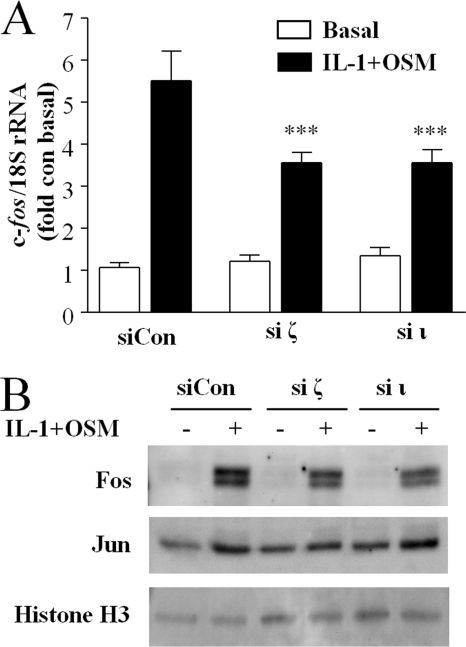
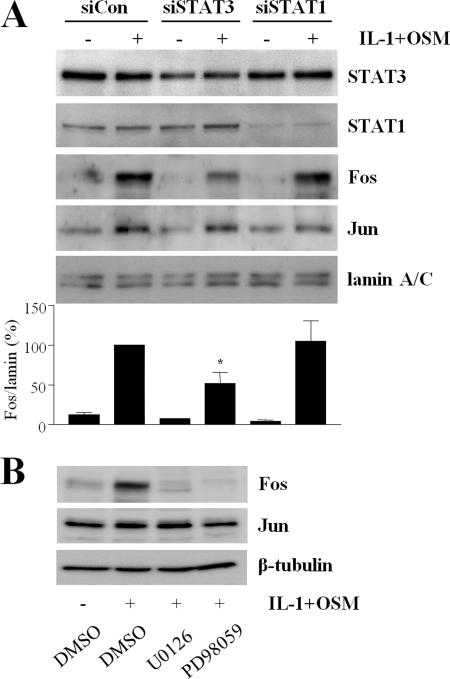
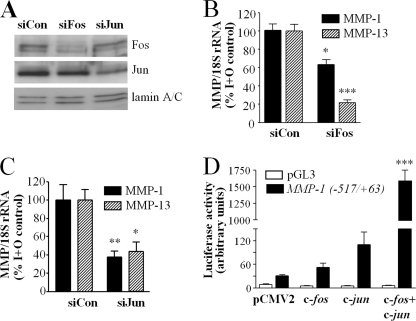
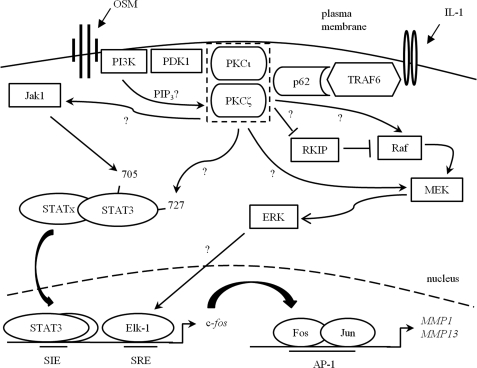
The protein kinase C (PKC) signaling pathway is a major regulator of cellular functions and is implicated in pathologies involving extracellular matrix remodeling. Inflammatory joint disease is characterized by excessive extracellular matrix catabolism, and here we assess the role of PKC in the induction of the collagenases, matrix metalloproteinase (MMP)-1 and MMP-13, in human chondrocytes by the potent cytokine stimulus interleukin-1 (IL-1) in combination with oncostatin M (OSM). IL-1 + OSM-stimulated collagenolysis and gelatinase activity were ameliorated by pharmacological PKC inhibition in bovine cartilage, as was collagenase gene induction in human chondrocytes. Small interfering RNA-mediated silencing of PKC gene expression showed that both novel (nPKC delta, nPKC eta) and atypical (aPKC zeta, aPKC iota) isoforms were involved in collagenase induction by IL-1. However, MMP1 and MMP13 induction by IL-1 + OSM was inhibited only by aPKC silencing, suggesting that only atypical isoforms play a significant role in complex inflammatory milieus. Silencing of either aPKC led to diminished IL-1 + OSM-dependent extracellular signal-regulated kinase (ERK) and signal transducer and activator of transcription (STAT) 3 phosphorylation, and c-fos expression. STAT3 gene silencing or ERK pathway inhibition also resulted in loss of IL-1 + OSM-stimulated c-fos and collagenase expression. Silencing of c-fos and c-jun expression was sufficient to abrogate IL-1 + OSM-stimulated collagenase gene induction, and overexpression of both c-fos and c-jun was sufficient to drive transcription from the MMP1 promoter in the absence of a stimulus. Our data identify atypical PKC isozymes as STAT and ERK activators that mediate c-fos and collagenase expression during IL-1 + OSM synergy in human chondrocytes. aPKCs may constitute potential therapeutic targets for inflammatory joint diseases involving increased collagenase expression.


Figures

FIGURE 1.
FIGURE 1.
PKC inhibition ameliorates IL-1 + OSM-stimulated cartilage degradation. Bovine nasal cartilage explant cultures were stimulated with IL-1 (1 ng/ml) and OSM (10 ng/ml) for 14 days, with fresh medium and cytokines at day 7, in the presence of dimethyl sulfoxide (DMSO) vehicle control or PKC inhibitors Gö6976 (10 μm), Gö6983 (20 μm), or calphostin C (2 μm). Medium was assayed for (A) collagen release and collagenase activity, or (B) gelatinase activity. Cumulative collagen released by day 14 was expressed as a percentage of the total for each treatment, and active collagenolytic activity in the day 14 culture supernatants was determined by bioassay (mean ± S.E.; ***, p < 0.001; **, p < 0.01; *, p < 0.05 compared with IL-1+OSM control). Data were pooled from 3 chondrocyte populations, each conducted in quadruplicate (A), or representative of two separate experiments (B).
FIGURE 2.
FIGURE 2.
Modulation of PKC activity regulates collagenase expression in human chondrocytes. A, primary human articular chondrocytes were stimulated with IL-1 (0.02 ng/ml) + OSM (10 ng/ml) for 24 h ± 1 h preincubation with phorbol 12-myristate 13-acetate (100 nm). Cell lysates were subjected to reverse transcriptase-PCR (“Experimental Procedures”) and relative expression levels of MMP1 and MMP13 mRNA, normalized to the 18 S rRNA housekeeping gene, were determined. B, chondrocytes were preincubated (1 h) with concentrations of PKC inhibitors indicated prior to stimulation with IL-1 (0.02 ng/ml) + OSM (10 ng/ml) for 24 h and determination of MMP1 and MMP13 relative expression levels. C, chondrocytes were stimulated with IL-1 (0.02 ng/ml) ± OSM (10 ng/ml) for 24 h ± preincubation with PKC inhibitors at the concentrations indicated. Culture medium was assessed for MMP-1 and MMP-13 using specific immunoassays. Data (mean ± S.E.; ***, p < 0.001; **, p < 0.01; *, p < 0.05) were compared with dimethyl sulfoxide (DMSO) vehicle control (A), or control stimulated values (B and C). Data were pooled from three separate chondrocyte populations, each conducted in hextuplicate.
FIGURE 3.
FIGURE 3.
IL-1 + OSM stimulation enhances PKC priming and substrate phosphorylation. A and B, primary human articular chondrocytes were stimulated with IL-1 (0.2 ng/ml) or OSM (10 ng/ml) for the times indicated (A) or with IL-1 + OSM for 20 min ± preincubation with Gö6976 (B). Cell lysates were prepared and subjected to SDS-PAGE and immunoblotting (“Experimental Procedures”) using the antibodies indicated. Ser(P)-158 MARCKS is illustrated by the upper arrowed band. C, chondrocytes were stimulated with IL-1 (0.2 ng/ml) or OSM (10 ng/ml) for 20 min, harvested, and subjected to subcellular fractionation (“Experimental Procedures”). Fractions were resolved by SDS-PAGE and analyzed by immunoblotting using the antibodies indicated. Immunoblots shown are representative of three separate experiments each using chondrocyte cultures from different donors. Bas, basal; cyt, cytoplasm; mem, membrane; nuc, nucleus.
FIGURE 4.
FIGURE 4.
PKC isoform silencing regulates collagenase expression in human chondrocytes. A and B, following transfection with siRNA specific to PKC isoforms nPKCδ, nPKCη, aPKCζ, aPKCι, or non-targeting siControl (100 nm), chondrocytes were stimulated with (A) IL-1 (0.02 ng/ml) or (B) IL-1 and OSM (10 ng/ml) for 24 h. Cells were lysed and real time reverse transcription-PCR was performed for MMP1 and MMP13, 72 h after transfection. Protein depletion of individual, specific PKC isoforms was confirmed by SDS-PAGE and immunoblotting (A, inset). In some experiments (C), chondrocytes were transfected with siRNA combined (100 nm total) targeting either nPKC (δ+η) or aPKC (ζ+ι) isoforms, prior to stimulation with IL-1 + OSM, and expression of MMP10 mRNA was measured (inset, open bars, basal; striped bars, stimulated) as well as MMP1 and MMP13. Data are pooled from at least three separate chondrocyte populations (each assayed in hextuplicate) presented as a percentage of the cytokine-induced expression (specific siPKC transfected versus siCon-transfected; mean ± S.E.; ***, p < 0.001; **, p < 0.01; *, p < 0.05).
FIGURE 5.
FIGURE 5.
Atypical PKC gene silencing curtails IL-1 + OSM-stimulated STAT3 and ERK phosphorylation. A, primary human articular chondrocytes were transfected with siRNA (100 nm) specific to aPKCζ, aPKCι, or siCon non-targeting control, prior to stimulation with IL-1 (0.2 ng/ml) and OSM (10 ng/ml) for 20 min. Cells were lysed and proteins resolved by SDS-PAGE. Immunoblots were probed using the antibodies indicated. Blots shown are representative of three to six experiments using chondrocytes from different donors, and histograms show quantification of bands normalized to β-tubulin levels presented as a percentage of the cytokine-induced expression (siCon-transfected) (mean ± S.E.; ***, p < 0.001, **, p < 0.01; *, p < 0.05). Comparisons shown are stimulated (siCon versus siPKC) or siCon-stimulated versus all conditions for RKIP*S153. B, chondrocytes were incubated with MEK inhibitors UO126 or PD98059 (both 10 μm), or DMSO vehicle for 1 h prior to stimulation with IL-1 (0.02 ng/ml) and OSM (10 ng/ml). Cell lysates were prepared and proteins resolved by SDS-PAGE, and immunoblots were probed using the indicated antibodies. Blots shown are representative of three experiments using chondrocytes from different donors.
FIGURE 6.
FIGURE 6.
STAT3 gene silencing and ERK pathway inhibition abrogate collagenase induction. A, primary human articular chondrocytes were transfected with siRNA (100 nm) specific to STAT1, STAT3, or siCon non-targeting control, prior to stimulation with OSM (10 ng/ml) for 20 min. Cells were lysed and proteins resolved by SDS-PAGE. Immunoblots were probed using the antibodies indicated. B, chondrocytes were transfected as above, but subsequently stimulated with IL-1 (0.02 ng/ml) and OSM (10 ng/ml) for 24 h. Real time reverse transcription-PCR from the isolated RNA was performed for MMP1 and MMP13, 72 h after transfection. C, bovine cartilage explant cultures were stimulated with IL-1 (1 ng/ml) and OSM (10 ng/ml) for 14 days, with fresh medium and cytokines at day 7, in the presence of DMSO vehicle control or MEK inhibitor UO126 (10 μm). Medium assayed for cumulative collagen release by day 14 were expressed as a percentage of the total for each treatment. D, chondrocytes were incubated with UO126 (3 μm) or DMSO vehicle for 1 h prior to stimulation with IL-1 (0.02 ng/ml) and OSM (10 ng/ml) for 24 h. Real time reverse transcription-PCR of the isolated RNA was performed for MMP1 and MMP13. Data are representative of (A) or pooled from (B-D) three separate chondrocyte populations (each assayed in at least quadruplicate) compared with stimulated control (mean ± S.E.; ***, p < 0.001).
FIGURE 7.
FIGURE 7.
Atypical PKC gene silencing inhibits IL-1 + OSM-stimulated c-fos expression. A, following transfection with siRNA specific to aPKCζ, aPKCι, or non-targeting siControl (100 nm), chondrocytes were stimulated with IL-1 (0.02 ng/ml) and OSM (10 ng/ml) for 45 min. Real time reverse transcription-PCR of the isolated RNA was performed for c-fos. Data were pooled from two separate chondrocyte populations (each assayed in hextuplicate) presented as a percentage of the cytokine-induced expression (specific siPKC transfected versus siCon-transfected; mean ± S.E.; ***, p < 0.001). B, human chondrocytes were transfected with siRNA (100 nm) specific to aPKCζ, aPKCι, or siCon non-targeting control, prior to stimulation with IL-1 (0.2 ng/ml) and OSM (10 ng/ml) for 3 h. Nuclear extracts were isolated and proteins resolved by SDS-PAGE. Immunoblots were probed using the antibodies indicated. Blots shown are representative of three experiments using chondrocytes from different donors.
FIGURE 8.
FIGURE 8.
STAT3 gene silencing and ERK pathway inhibition curtail Fos expression. A, primary human articular chondrocytes were transfected with siRNA (100 nm) specific to STAT1, STAT3, or siCON non-targeting control, prior to stimulation with IL-1 (0.2 ng/ml) and OSM (10 ng/ml) for 3 h. Nuclear extracts were isolated, and proteins were resolved by SDS-PAGE. Immunoblots were probed using the antibodies indicated. Blots shown are representative of four experiments using chondrocytes from different donors, and the histogram shows quantification of bands normalized to lamin A/C levels presented as a percentage of the cytokine-induced expression (siCon-transfected), mean ± S.E.; *, p < 0.05). Comparisons shown are stimulated (siCon versus siSTAT). B, chondrocytes were incubated with MEK inhibitors UO126 or PD98059 (both 10 μm), or DMSO vehicle for 1 h prior to stimulation with IL-1 (0. 2 ng/ml) and OSM (10 ng/ml) for 3 h. Nuclear extracts were isolated, and proteins were resolved by SDS-PAGE. Immunoblots were probed using the antibodies indicated. Blots are representative of three experiments using chondrocytes from different donors.
FIGURE 9.
FIGURE 9.
Collagenase expression and MMP1 promoter activity are dependent upon canonical AP-1 components. A, primary human articular chondrocytes were transfected with siRNA (100 nm) specific to c-fos, c-jun, or siCon non-targeting control, prior to stimulation with IL-1 (0.2 ng/ml) and OSM (10 ng/ml) for 3 h. Nuclear extracts were isolated, and proteins were resolved by SDS-PAGE. Immunoblots were probed using the antibodies indicated. Blots shown are representative of two experiments using chondrocytes from different donors. B and C, following transfection with siRNA specific to c-fos, c-jun, or siCon (100 nm), chondrocytes were stimulated with IL-1 (0.02 ng/ml) and OSM (10 ng/ml) for 24 h and real time reverse transcription-PCR of the isolated RNA was performed for MMP1 and MMP13, 72 h after transfection. Data are pooled from at least three separate chondrocyte populations (each assayed in hextuplicate) presented as a percentage of the cytokine-induced expression (specific siPKC transfected versus siCon-transfected; mean ± S.E.; ***, p < 0.001; **, p < 0.01; *, p < 0.05). D, T/C28a4 human chondrocytes were transiently co-transfected with pCMV2 plasmid alone or constructs for overexpression of c-fos, c-jun, or both c-fos and c-jun, together with a pGL3-derived construct harboring the proximal (−517/+63) region of the human MMP1 promoter controlling luciferase expression or empty vector control. Luciferase activity was determined and data are representative of two experiments conducted in quadruplicate; mean ± S.E.; ***, p < 0.001 compared with pCMV alone.
FIGURE 10.
FIGURE 10.
Hypothetical mechanism for IL-1 + OSM-stimulated collagenase induction via aPKC activity in chondrocytes. PKCζ or PKCι become activated after IL-1 stimulation (via TNF receptor-associated factor 6 (TRAF6) and p62/sequestosome 1 activity) and/or OSM (via PI3K-dependent phosphatidylinositol 3,4,5′-trisphosphate increases or phosphoinositide-dependent kinase-1 (PDK-1) activity). The proximity of PKCζ and PKCι in the schematic does not denote association with each other, merely proximity to potential activators. Once activated, aPKC may activate STAT3, directly by phosphorylation on Ser-727 and/or indirectly via Jak1 activation, leading to phosphorylation on Tyr-705. aPKC may also lead to ERK activation, by inhibition of RKIP or activation of Raf or MEK. Activated STAT3 homo- or heterodimers and ERK then lead to induction of c-fos, by binding the Sis-inducible element (SIE) or activation of Elk-1 and subsequent serum response element (SRE) binding, respectively, at the c-fos promoter. Translated Fos then mediates collagenase promoter activation via AP-1 binding in partnership with c-Jun. The scheme is based on the current study and input from Refs. , , , , , and .

Similar articles

Cited by

References

    1. Sakkas L. I., Platsoucas C. D. (2007) Arthritis Rheum. 56, 409–424 - PubMed
    1. Scrivo R., Di Franco M., Spadaro A., Valesini G. (2007) Ann. N. Y. Acad. Sci. 1108, 312–322 - PubMed
    1. Goldring M. B., Goldring S. R. (2007) J. Cell Physiol. 213, 626–634 - PubMed
    1. Koenders M. I., Joosten L. A., van den Berg W. B. (2006) Ann. Rheum. Dis. 65, Suppl. 3, iii29–33 - PMC - PubMed
    1. Hui W., Cawston T., Rowan A. D. (2003) Ann. Rheum. Dis. 62, 172–174 - PMC - PubMed

Publication types

MeSH terms

LinkOut - more resources