. 2010 Jul 23;285(30):23387-97.
doi: 10.1074/jbc.M110.105619. Epub 2010 May 12.

Protein kinase D is implicated in the reversible commitment to differentiation in primary cultures of mouse keratinocytes

Affiliations

Protein kinase D is implicated in the reversible commitment to differentiation in primary cultures of mouse keratinocytes

Azadeh Jadali et al. J Biol Chem. .

Abstract

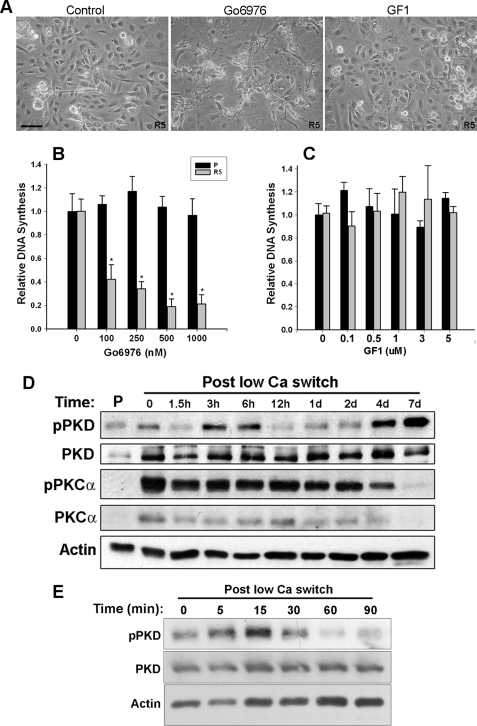
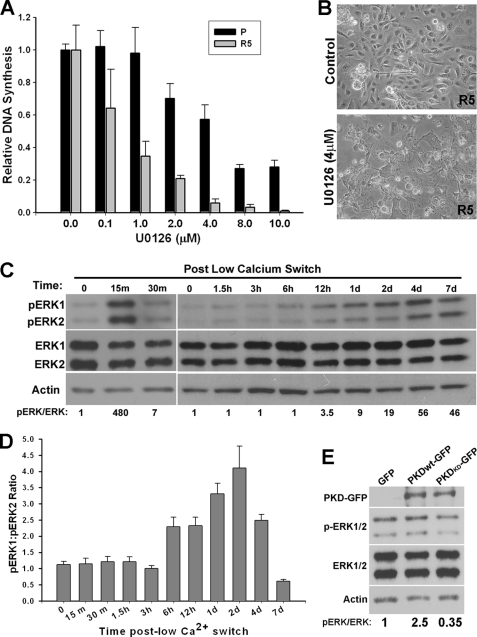
Although commitment to epidermal differentiation is generally considered to be irreversible, differentiated keratinocytes (KCs) have been shown to maintain a regenerative potential and to reform skin epithelia when placed in a suitable environment. To obtain insights into the mechanism of reinitiation of this proliferative response in differentiated KCs, we examined the reversibility of commitment to Ca(2+)-induced differentiation. Lowering Ca(2+) concentration to micromolar levels triggered culture-wide morphological and biochemical changes, as indicated by derepression of cyclin D1, reinitiation of DNA synthesis, and acquisition of basal cell-like characteristics. These responses were inhibited by Goedecke 6976, an inhibitor of protein kinase D (PKD) and PKCalpha, but not with GF109203X, a general inhibitor of PKCs, suggesting PKD activation by a PKC-independent mechanism. PKD activation followed complex kinetics with a biphasic early transient phosphorylation within the first 6 h, followed by a sustained and progressive phosphorylation beginning at 24 h. The second phase of PKD activation was followed by prolonged ERK1/2 signaling and progression to DNA synthesis in response to the low Ca(2+) switch. Specific knockdown of PKD-1 by RNA interference or expression of a dominant negative form of PKD-1 did not have a significant effect on normal KC proliferation and differentiation but did inhibit Ca(2+)-mediated reinitiation of proliferation and reversion in differentiated cultures. The present study identifies PKD as a major regulator of a proliferative response in differentiated KCs, probably through sustained activation of the ERK-MAPK pathway, and provides new insights into the process of epidermal regeneration and wound healing.


Figures

FIGURE 1.
FIGURE 1.
Reinitiation of DNA synthesis and reversal of differentiation in differentiated epidermal cultures exposed to low Ca2+ conditions. A, schematic representation of the culture conditions used in this study. Primary cultures of KCs grown in 0.05 mm Ca2+ to confluence (P) were exposed to 1.2 mm Ca2+ for 3 days to induce differentiation (D). Differentiated cultures were reverted by subsequent exposure to 0.05 mm Ca2+-containing medium for 7 days (R). B, phase-contrast images showing morphology of KCs in proliferative stage (P), 3 days after Ca2+-induced differentiation (D3), and in reverted cultures after 2 (R2), 4 (R4), and 7 days (R7). Some of the 7-day cultures were induced to differentiate for a second time (R7D3). Bar, 50 μm. C, proliferation rates in various culture conditions were measured by either BrdUrd labeling (6-h pulse) or [3H]thymidine incorporation (16-h pulse) as described under “Experimental Procedures.” Values are expressed as mean ± S.D. (error bars) of three independent experiments quantified in a total of nine different samples. *, p < 0.001 when comparing differentiation day 3 to either proliferative stage or reverted cultures. D, quantitative RT-PCR analysis of the transcript levels of p63, keratin 10 (K10), INV, filaggrin (FIL), and loricrin (LOR) in KCs at proliferative stage, 3 days after Ca2+-induced differentiation, and in reverted cultures after 2, 4, and 7 days. Transcript levels were normalized to phosphoglycerate kinase. E, protein lysates of KCs at proliferative stage, 3 days after Ca2+-induced differentiation, and in reverted cultures after 2, 4, and 7 days were analyzed by immunoblotting for the indicated proteins. Actin was used as a loading control.
FIGURE 2.
FIGURE 2.
Differentiation-resistant KCs do not account for repopulation of differentiated cultures in response to the low Ca2+ switch. A, KCs were transduced with a retrovirus encoding GFP either before (P-GFP) or after (D-GFP) Ca2+-induced differentiation, and the percentage of transduced cells was quantified by GFP-FACS analysis either at 48 h post-transduction (P-GFP and D-GFP) or after differentiation and the subsequent exposure to low Ca2+ conditions for 7 days (P-GFP-R7 and D-GFP-R7). The percentage of labeled cells is indicated in the top right corner of the graphs. B, protein lysates of KCs in proliferative condition (P), differentiated for 3 days (time 0), and at the indicated time points after the low Ca2+ switch were analyzed by immunoblotting for cyclin D1 and actin (as a loading control). These experiments were repeated three times, yielding similar results.
FIGURE 3.
FIGURE 3.
Involvement of PKD in reinitiation of a proliferative program in differentiated cultures. A, morphological changes in differentiated cultures treated with either DMSO (control), 1 μm Go6976, or 1 μm GF1 were analyzed by phase-contrast microscopy in cultures reverted for 5 days. Bar, 50 μm. B and C, relative DNA synthesis measured by [3H]thymidine incorporation in proliferative (P) or reverted cultures (R5) treated at the time of the low Ca2+ switch with increasing concentrations of either Go6976 (B) or GF1 (C). Similar results were obtained when cultures were pretreated for 1 h prior to the low Ca2+ switch. Bars, mean ± S.D. (error bars) of three independent experiments, each in triplicate. *, p < 0.01 when compared with untreated cultures. D, the kinetics of PKD activity in response to the low Ca2+ switch were analyzed in cell lysates prepared from proliferating or differentiated KCs exposed to low Ca2+ conditions for time indicated at the top by Western blotting using antibody against phosphorylated PKD-1 (pPKD) (Ser916) or phospho-PKCα (pPKC). The levels of total PKD-1 (using antibody CS-2052) or PKCα were determined. Actin was used as a loading control. E, a shorter time course of PKD phosphorylation in response to the low Ca2+ switch showing a rapid and transient PKD autophosphorylation. Similar results were obtained in three independent experiments.
FIGURE 4.
FIGURE 4.
PKC-independent activation of PKD in response to the low Ca2+ switch. A, protein lysates from proliferative (P) or differentiated KCs switched to low Ca2+ conditions for indicated times were analyzed by Western blotting using site-specific antibodies to measure changes in the levels of phosphorylated PKD1 at Ser744 (pS744), Ser748 (pS748), or Ser916 (pS916). The ratio of phospho-PKD (Ser916) to total PKD (using antibody SC-935) is shown at the bottom. B, to show comparable affinity of site-specific phospho-PKD antibodies used above, proliferative cultures were treated with 100 nm TPA for 10 min, and cell lysates were analyzed by immunoblotting as described above.
FIGURE 5.
FIGURE 5.
PKD plays a critical role in the reinitiation of a proliferative response in differentiated KCs. A, Western blot analysis of KCs showing efficient knockdown of PKD by RNA interference. Proliferative cultures of KCs were transduced with retroviral vectors encoding two different shRNAs against PKD1 (shRNA-1 or shRNA-2) or a control shRNA (C-shRNA). Transduced cells were induced to differentiate for 3 days and analyzed by immunoblotting for PKD1 and actin. B, the graph shows a significant inhibition of DNA synthesis as measured by [3H]thymidine incorporation in reverted (R5, gray bars) but not in proliferating (P, black bars) cultures expressing PKD1-specific shRNA. The bars represent the mean ± S.D. of four independent experiments, each performed in triplicates. *, p < 0.0001 comparing reverted cultures of PKD knockdown groups with controls. C, phase-contrast and GFP fluorescent images of cultures overexpressing either the wild type (PKDWT-GFP) or dominant negative (PKDKD-GFP) forms of PKD1 as a fusion with GFP at 5 days after the low Ca2+ switch. The arrow in the insets in C shows the expected morphological change in non-transduced KCs in the same culture. D, the graph shows the effect of overexpression of PKDWT or PKDKD on DNA synthesis in proliferating (P; black bars) or in reverted cultures (R5; gray bars). Results are expressed as means ± S.D. of three independent experiments, each performed in triplicates. *, p < 0.001 when comparing R5-PKDKD with R5-GFP; #, p = 0.042 when comparing R5-PKDWT with R5-GFP.
FIGURE 6.
FIGURE 6.
Involvement of ERK-MAPK pathway in reinitiation of the proliferative response in differentiated KCs. A, relative DNA synthesis was measured by [3H]thymidine incorporation in proliferative (P; black bars) or reverted cultures (R5; gray bars) treated with increasing concentrations of U0126 as described under “Experimental Procedures.” Values shown represent means ± S.D. of the results of three separate experiments, each performed in duplicate. B, phase-contrast images showing the morphology of R5 cultures treated at the time of the low Ca2+ switch with 4 μm U0126 or DMSO (control). C, time course of ERK1/2 phosphorylation in response to the low Ca2+ switch. Protein lysates of differentiated KCs at the indicated time points following exposure to 0.05 mm Ca2+ were analyzed by immunoblotting for phosphorylated ERK1/2, total ERK1/2, and actin. The relative levels of total activated ERK are indicated at the bottom. D, the ratio of phospho-ERK1 to phospho-ERK2 was determined by densitometric scanning of the corresponding bands. The results shown are the mean ± S.D. from three blots. E, differentiated KCs expressing wild type (PKDWT-GFP) or dominant negative (PKDKD-GFP) forms of PKD were exposed to low Ca2+ conditions for 48 h, followed by Western blot analysis for the indicated antibodies. PKD-GFP shows comparable expression of the exogenous PKD. The relative levels of total activated ERK are indicated at the bottom. This experiment was repeated twice, yielding a similar pattern.

Similar articles

Cited by

References

    1. Fuchs E. (1990) Curr. Opin. Cell Biol. 2, 1028–1035 - PubMed
    1. Crish J. F., Bone F., Balasubramanian S., Zaim T. M., Wagner T., Yun J., Rorke E. A., Eckert R. L. (2000) Carcinogenesis 21, 1031–1037 - PubMed
    1. Carroll J. M., Romero M. R., Watt F. M. (1995) Cell 83, 957–968 - PubMed
    1. Hennings H., Michael D., Cheng C., Steinert P., Holbrook K., Yuspa S. H. (1980) Cell 19, 245–254 - PubMed
    1. Dotto G. P. (1999) Crit. Rev. Oral Biol. Med. 10, 442–457 - PubMed

Publication types

MeSH terms