. 2010 Jul 16;285(29):22328-37.
doi: 10.1074/jbc.M110.123299. Epub 2010 May 12.

CD69 suppresses sphingosine 1-phosophate receptor-1 (S1P1) function through interaction with membrane helix 4

Affiliations

CD69 suppresses sphingosine 1-phosophate receptor-1 (S1P1) function through interaction with membrane helix 4

Alexander J Bankovich et al. J Biol Chem. .

Abstract

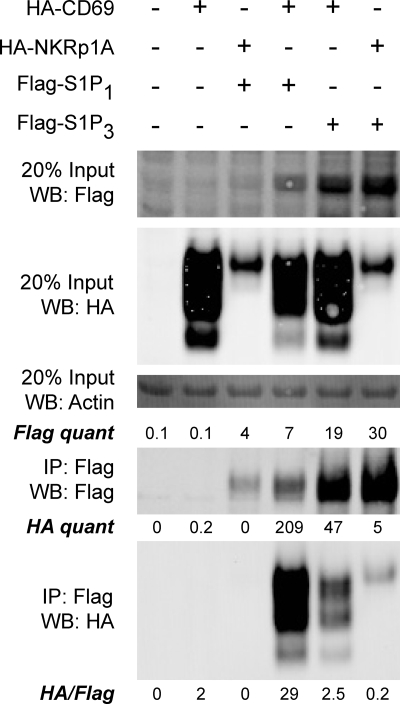
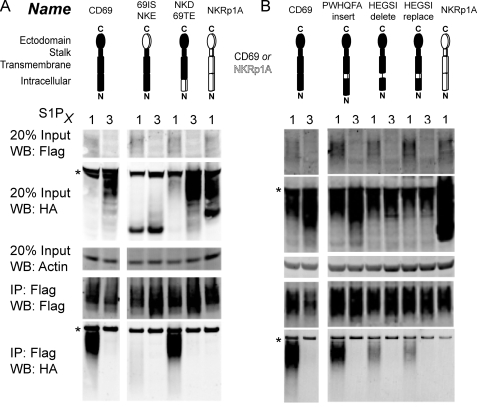
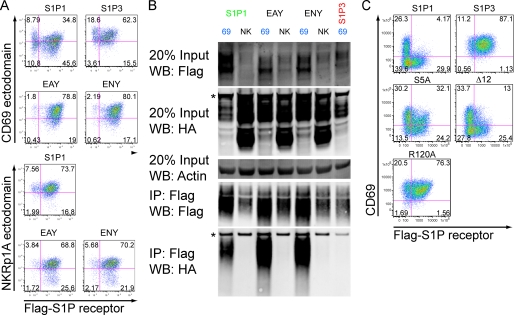
Lymphocyte egress from lymph nodes requires the G-protein-coupled sphingosine 1-phosphate receptor-1 (S1P(1)). The activation antigen CD69 associates with and inhibits the function of S1P(1), inhibiting egress. Here we undertook biochemical characterization of the requirements for S1P(1)-CD69 complex formation. Domain swapping experiments between CD69 and the related type II transmembrane protein, NKRp1A, identified a requirement for the transmembrane and membrane proximal domains for specific interaction. Mutagenesis of S1P(1) showed a lack of requirement for N-linked glycosylation, tyrosine sulfation, or desensitization motifs but identified a requirement for transmembrane helix 4. Expression of CD69 led to a reduction of S1P(1) in cell lysates, likely reflecting degradation. Unexpectedly, the S1P(1)-CD69 complex exhibited a much longer half-life for binding of S1P than S1P(1) alone. In contrast to wild-type CD69, a non-S1P(1) binding mutant of CD69 failed to inhibit T cell egress from lymph nodes. These findings identify an integral membrane interaction between CD69 and S1P(1) and suggest that CD69 induces an S1P(1) conformation that shares some properties of the ligand-bound state, thereby facilitating S1P(1) internalization and degradation.


Figures

FIGURE 1.
FIGURE 1.
CD69 and S1P1 interact in mouse 3T3 fibroblast cells. Cells expressing or co-expressing the indicated constructs were lysed and subjected to immunoprecipitation with anti-Flag M2 beads. The material in the IP was then run on SDS-PAGE and Western blotted for Flag to detect the S1P receptor, and for HA to detect the C-type lectin construct and actin as a loading control. The amount of each protein in the cell lysate was compared with the amount immunoprecipitated by Flag-S1P1 with anti-Flag antibody. When equivalent amounts of Flag were immunoprecipitated, there was a 10-fold greater interaction between CD69 and S1P1 when compared with the interaction with control proteins NKRp1A and S1P3. This result is representative of two experiments.
FIGURE 2.
FIGURE 2.
Interaction between mutant CD69, containing targeted sequence swaps with hNKRp1A, and S1P1 or S1P3 in WEHI-231 cells. A, cells co-expressing the indicated constructs were lysed and subject to immunoprecipitation with anti-Flag M2 beads and then Western blotted to detect Flag-S1P1 or Flag-S1P3 and HA-CD69, HA-NKRp1A, or HA-CD69/NKRp1A chimeric constructs. Diagrams indicate regions of CD69 (filled) or NKRp1A (open) used in each construct. B, co-IP and Western blotting of further chimeric molecules derived by expanding the minimal predicted transmembrane domain to include the stalk or to include an additional six intracellular amino acids. These results are representative of two experiments. Nonspecific bands are indicated with an asterisk.
FIGURE 3.
FIGURE 3.
Interaction between mutant CD69, containing stalk sequence swaps with hNKRp1A, and S1P1 or S1P3. A, co-IP and Western blotting of Flag-S1P receptors and HA-CD69 constructs containing swaps of small sequences of the CD69 stalk to the analogous sequence in NKRp1A, and HA-NKRp1A construct with the entire CD69 stalk. B, co-IP of CD69 and NKRpA1 stalk mutant 69NKS1N, with NKRp1A sequence QKSSIEK, and stalk mutant 69NKS1C, with the N-terminal stalk sequence SVDIQQS. These data are representative of two experiments with similar results. Nonspecific bands are indicated with an asterisk.
FIGURE 4.
FIGURE 4.
Interaction between chimeric CD69 molecules, including constructs with modifications of the HEGSI motif, and S1P1 or S1P3. A, two 3-domain constructs analyzed compared with wild-type CD69 as in Fig. 2. B, co-IP and Western blotting of further HEGSI mutants to narrow down the contribution to binding. These data are representative of two experiments with similar results. Nonspecific bands are indicated with an asterisk.
FIGURE 5.
FIGURE 5.
Co-IP of CD69 with ectodomain S1P1 mutants. A, tyrosine sulfation (Y-Sulfo), N-glycosylation (N30D), human S1P1 (huS1P1), reciprocal N-terminal swap mutants (S1P1+3 and S1P3+1), and intracellular loop mutant (S1P31313) were compared with S1P1 and S1P3 in their ability to co-IP mouse HA-CD69 as in Fig. 2. B, co-IP of S1P1 desensitization mutants, S5A, Δ12 are shown along with the S1P non-binding mutant R120A. These data are representative of two experiments with similar results.
FIGURE 6.
FIGURE 6.
Co-IP of CD69 with S1P1 mutants containing swapped transmembrane regions. The schematics above the labels designate the different helices of S1P1 (solid lines and filled rectangles) that were swapped with the analogous sequence for S1P3 (dashed lines and unfilled rectangles). These constructs are labeled S1P13A-G where A refers to transmembrane domain 1 and G to transmembrane domain 7. Co-IP and Western blotting was performed as in Fig. 2. The densitometry readings show the ratio of HA signal to Flag signal indicating the relative ability of CD69 to co-IP with the mutant S1P1 constructs. These data are representative of two experiments with similar results.
FIGURE 7.
FIGURE 7.
The S1P1 helix 4 is necessary and sufficient for most of the interaction with CD69. A, co-IP of S1P13D1–3 constructs where the intracellular loop (D1), minimal predicted transmembrane domain (D2), or extracellular loop (D3) of the S1P1D (membrane helix 4) construct have been swapped with the corresponding region of S1P3. B, co-IP of the S1P31D is the converse construct from the S1P13D with all regions from S1P3 except helix 4. Schematics showing helix 4 of the construct used designate the S1P1 regions of the construct with solid lines and filled rectangles, whereas the S1P3 regions are designated by dashed lines and unfilled rectangles. These data are representative of two experiments with similar results. Nonspecific bands are indicated with an asterisk.
FIGURE 8.
FIGURE 8.
CD69-mediated down-modulation of S1P1 is associated with protein degradation. A, flow cytometric analysis of Flag-S1P1 or Flag-S1P3 when co-transduced and sorted for low or high levels of CD69 in WEHI-231 cells. The relative amount of CD69 expression (+ or ++) was determined by expression of an IRES GFP reporter. Histogram overlays on the right show GFP reporter and hCD4 reporter expression for cells in quadrant 1 and 2 of the top left plot, indicating the relative expression of the CD69-IRES-GFP construct and the Flag-S1P1-IRES-hCD4 construct, respectively. B, co-IP of S1P1 or S1P3 with CD69 from the cells shown in the flow cytometric analysis. Densitometry readings are indicated showing the intensity of Flag and HA signal and the calculation of the ratio of HA signal to Flag signal is shown beneath the lower panel. These data are representative of two experiments using standard lysis buffer (see “Experimental Procedures”) and one experiment using 1% Triton X in place of Brij97 and Nonidet P-40 with similar results. Nonspecific bands are indicated with an asterisk.
FIGURE 9.
FIGURE 9.
Interaction between CD69 and S1P1-containing mutations in the G-protein-interacting ERY motif or the cytoplasmic tail. A, flow cytometric analysis of S1P1 ERY motif mutants, EAY and ENY, or S1P3 as a control, co-transduced with CD69 and hNKRp1A in WEHI-231 cells. Cells are costained for the CD69 ectodomain and the Flag-S1P receptors and mutants as indicated. B, co-IP experiment for the S1P1 mutants or S1P3 as indicated. These data are representative of two experiments with similar results. C, flow cytometric analysis of desensitization mutants (S5A, Δ12) and S1P non-binding mutant (R120A), co-transduced with CD69 and hNKRp1A in WEHI-231 cells. Cells are co-stained for the CD69 ectodomain and the Flag-S1P receptors and mutants as indicated. Nonspecific bands are indicated with an asterisk.
FIGURE 10.
FIGURE 10.
Dissociation data to determine the half-life for S1P binding to the S1P1-CD69 complex. WEHI-231 cells (2 × 10⁵) transduced with S1P1 or co-transduced with CD69 and S1P1 were treated with 200 pm [33P]S1P on ice for 30′. Cold S1P (2 mm) was added, and the amount of labeled S1P that was cell associated following the incubation times shown was measured. S1P1 half-life was measured to be 1.33 ± 0.6 min (n = 2) and S1P1-CD69 half-life was measured to be 13 ± 5 min (n = 4).
FIGURE 11.
FIGURE 11.
Requirement for CD69 interaction with S1P1 to inhibit lymphocyte chemotaxis and egress from lymph nodes. A, transwell migration assay testing CD69 and relevant CD69/NKRp1A chimeric molecules for their ability to inhibit S1P1-dependent S1P migration. Migration to SDF-1α, a CXCR4 ligand, is shown as a negative control. B, schematic of cell transfer experiment. Donor cells were activated for 24 h with anti-CD3/CD28 antibodies before transduction of the indicated recombinant retroviruses. These three CMTMR and congenically marked cell populations were then mixed and injected into recipient mice. Half of these mice were analyzed 24 h post-transfer and half where treated at 24 h with α4 and αL integrin-neutralizing antibodies to block LN entry and LN cells were analyzed 18 h later. C, flow cytometric analysis showing transferred CD4 cells, distinguishing 6N6-Δ31-transduced cells (CMTMR) from CD69-transduced cells (CMTMR+) in the same LN preparation. Transduced cells with high GFP reporter expression were gated and the percent of these cells among total LN cells is shown. D, ratio of transduced cells remaining in LNs following 18 h of α4 plus αL antibody treatment compared with the starting number of cells. This result is representative of two independent experiments.

References

    1. Matloubian M., Lo C. G., Cinamon G., Lesneski M. J., Xu Y., Brinkmann V., Allende M. L., Proia R. L., Cyster J. G. (2004) Nature 427, 355–360 - PubMed
    1. Hall J. G., Morris B. (1965) Br. J. Exp. Pathol. 46, 450–454 - PMC - PubMed
    1. Sprent J., Miller J. F., Mitchell G. F. (1971) Cell Immunol. 2, 171–181 - PubMed
    1. Shiow L. R., Rosen D. B., Brdicková N., Xu Y., An J., Lanier L. L., Cyster J. G., Matloubian M. (2006) Nature 440, 540–544 - PubMed
    1. Mandala S., Hajdu R., Bergstrom J., Quackenbush E., Xie J., Milligan J., Thornton R., Shei G. J., Card D., Keohane C., Rosenbach M., Hale J., Lynch C. L., Rupprecht K., Parsons W., Rosen H. (2002) Science 296, 346–349 - PubMed

Publication types

MeSH terms

LinkOut - more resources