Pepscan mapping of viral hemorrhagic septicemia virus glycoprotein G major lineal determinants implicated in triggering host cell antiviral responses mediated by type I interferon
- PMID: 20463070
- PMCID: PMC2898232
- DOI: 10.1128/JVI.00023-10
Pepscan mapping of viral hemorrhagic septicemia virus glycoprotein G major lineal determinants implicated in triggering host cell antiviral responses mediated by type I interferon
Abstract
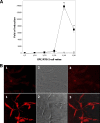
Surface glycoproteins of enveloped virus are potent elicitors of type I interferon (IFN)-mediated antiviral responses in a way that may be independent of the well-studied genome-mediated route. However, the viral glycoprotein determinants responsible for initiating the IFN response remain unidentified. In this study, we have used a collection of 60 synthetic 20-mer overlapping peptides (pepscan) spanning the full length of glycoprotein G (gpG) of viral hemorrhagic septicemia virus (VHSV) to investigate what regions of this protein are implicated in triggering the type I IFN-associated immune responses. Briefly, two regions with ability to increase severalfold the basal expression level of the IFN-stimulated mx gene and to restrict the spread of virus among responder cells were mapped to amino acid residues 280 to 310 and 340 to 370 of the gpG protein of VHSV. In addition, the results obtained suggest that an interaction between VHSV gpG and integrins might trigger the host IFN-mediated antiviral response after VHSV infection. Since it is known that type I IFN plays an important role in determining/modulating the protective-antigen-specific immune responses, the identification of viral glycoprotein determinants directly implicated in the type I IFN induction might be of special interest for designing new adjuvants and/or more-efficient and cost-effective viral vaccines as well as for improving our knowledge on how to stimulate the innate immune system.
Figures


Similar articles
-
Development of new therapeutical/adjuvant molecules by pepscan mapping of autophagy and IFN inducing determinants of rhabdoviral G proteins.Mol Immunol. 2016 Feb;70:118-24. doi: 10.1016/j.molimm.2015.10.008. Epub 2016 Jan 4. Mol Immunol. 2016. PMID: 26759988 Review.
-
VHSV G glycoprotein major determinants implicated in triggering the host type I IFN antiviral response as DNA vaccine molecular adjuvants.Vaccine. 2014 Oct 14;32(45):6012-9. doi: 10.1016/j.vaccine.2014.07.111. Epub 2014 Sep 6. Vaccine. 2014. PMID: 25203447
-
Role of Viral Hemorrhagic Septicemia Virus Matrix (M) Protein in Suppressing Host Transcription.J Virol. 2017 Sep 12;91(19):e00279-17. doi: 10.1128/JVI.00279-17. Print 2017 Oct 1. J Virol. 2017. PMID: 28747493 Free PMC article.
-
Rainbow Trout Erythrocytes ex vivo Transfection With a DNA Vaccine Encoding VHSV Glycoprotein G Induces an Antiviral Immune Response.Front Immunol. 2018 Oct 29;9:2477. doi: 10.3389/fimmu.2018.02477. eCollection 2018. Front Immunol. 2018. PMID: 30429850 Free PMC article.
-
Novirhabdoviruses versus fish innate immunity: A review.Virus Res. 2021 Oct 15;304:198525. doi: 10.1016/j.virusres.2021.198525. Epub 2021 Jul 30. Virus Res. 2021. PMID: 34339774 Review.
Cited by
-
Fish Red Blood Cells Modulate Immune Genes in Response to Bacterial Inclusion Bodies Made of TNFα and a G-VHSV Fragment.Front Immunol. 2019 May 22;10:1055. doi: 10.3389/fimmu.2019.01055. eCollection 2019. Front Immunol. 2019. PMID: 31178858 Free PMC article.
-
Protein Nanoparticles Made of Recombinant Viral Antigens: A Promising Biomaterial for Oral Delivery of Fish Prophylactics.Front Immunol. 2018 Jul 18;9:1652. doi: 10.3389/fimmu.2018.01652. eCollection 2018. Front Immunol. 2018. PMID: 30072996 Free PMC article.
-
Autophagy-inducing peptides from mammalian VSV and fish VHSV rhabdoviral G glycoproteins (G) as models for the development of new therapeutic molecules.Autophagy. 2014 Sep;10(9):1666-80. doi: 10.4161/auto.29557. Epub 2014 Jul 16. Autophagy. 2014. PMID: 25046110 Free PMC article.
-
Linear epitopes of PRRSV-1 envelope proteins ectodomains are not correlated with broad neutralization.Porcine Health Manag. 2024 Oct 21;10(1):44. doi: 10.1186/s40813-024-00393-7. Porcine Health Manag. 2024. PMID: 39434120 Free PMC article.
-
Attenuated Infectious Hematopoietic Necrosis Virus with Rearranged Gene Order as Potential Vaccine.J Virol. 2016 Nov 14;90(23):10857-10866. doi: 10.1128/JVI.01024-16. Print 2016 Dec 1. J Virol. 2016. PMID: 27681130 Free PMC article.
References
-
- Acosta, F., B. Collet, N. Lorenzen, and A. E. Ellis. 2006. Expression of the glycoprotein of viral haemorrhagic septicaemia virus (VHSV) on the surface of the fish cell line RTG-P1 induces type 1 interferon expression in neighbouring cells. Fish Shellfish Immunol. 21:272-278. - PubMed
-
- Ankel, A., M. R. Capobianchi, C. Castilleti, and F. Dianzani. 1994. Interferon induction by HIV glycoprotein 120: role of the V3 loop. Virology 205:34-43. - PubMed
-
- Ankel, H., D. F. Westra, S. Welling-Wester, and P. Lebon. 1998. Induction of interferon-alpha by glycoprotein D of herpes simplex virus: a possible role of chemokine receptors. Virology 251:317-326. - PubMed
-
- Basurco, B., and J. M. Coll. 1989. Spanish isolates and reference strains of viral haemorrhagic septicaemia virus shown similar protein size patterns. Bull. Eur. Assoc. Fish Pathol. 9:92-95.
-
- Bazzigher, L., J. Pavlovic, O. Haller, and P. Staeheli. 1992. Mx genes show weaker primary response to virus than other interferon-regulated genes. Virology 186:154-160. - PubMed
Publication types
MeSH terms
Substances
LinkOut - more resources
Full Text Sources
Miscellaneous

