. 2010 Jul;84(14):7396-404.
doi: 10.1128/JVI.00056-10. Epub 2010 May 12.

APOBEC3G contributes to HIV-1 variation through sublethal mutagenesis

Affiliations

APOBEC3G contributes to HIV-1 variation through sublethal mutagenesis

Holly A Sadler et al. J Virol. 2010 Jul.

Abstract

The mammalian APOBEC3 proteins are an important component of the cellular innate immune response to retroviral infection. APOBEC3G can extinguish HIV-1 infectivity by its incorporation into virus particles and subsequent cytosine deaminase activity that attacks the nascent viral cDNA during reverse transcription, causing lethal mutagenesis. It has been suggested, but not formally shown, that APOBEC3G can also induce sublethal mutagenesis, which would maintain virus infectivity and contribute to HIV-1 variation. To test this, we developed a novel model system utilizing an HIV-1 vector and a panel of APOBEC3G-expressing cells. We observed proviruses with single APOBEC3G-mediated mutations (in the presence or absence of Vif), occurring at distinct hot spots and which could be rescued and shown to have infectivity. These data indicate that APOBEC3G-dependent restriction of HIV-1 can result in viable viral progeny that harbor sublethal levels of G-to-A mutations. Such mutations have the potential to contribute significantly to HIV-1 evolution, pathogenesis, immune escape, and drug resistance.


Figures
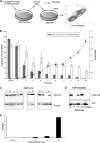
FIG. 1.
FIG. 1.
Correlation of HIV-1 infectivity loss by increased APOBEC3G expression. (A) Single-round HIV-1 vector assay. Virus was generated by transfecting stable A3G-expressing cell lines (or 293T controls) with either Vif or Vif+ HIV-1 vectors along with a VSV-G protein expression construct. Cell culture supernatants were collected, normalized for p24 levels, and then used to infect CEM-GFP cells. Infectivity was determined by flow cytometry as described in Materials and Methods. (B) Increased A3G expression levels reduce HIV-1 infectivity. A3G expression levels were determined for 10 stable cell lines and control 293T cells via immunoblot analysis. The mean infectivity of both Vif+ and Vif vector virus produced from these cell lines is shown. The results are from three independent experiments and are shown as average values ± standard deviations. The histogram bars indicate the level of virus infectivity, based upon the percentage of GFP-expressing cells. The black triangles represent the relative level of A3G expression normalized to the expression level of tubulin. (C) Immunoblot of A3G-expressing cell lines summarized in panel B. Three immunoblots showing A3G-expressing cell lines 1 to 10 are shown (cell line 9 is repeated on two blots to show consistency). (D) Immunoblot analysis of HIV-1 particles. Vif HIV-1 viral supernatants were purified and lysed, and A3G levels were determined by immunoblot analysis. A representative blot is shown. (E) Quantification of the immunoblot in panel D, normalized to p24 levels.
FIG. 2.
FIG. 2.
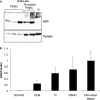
Comparison of A3G expression levels in stable cell lines to that of primary cells. (A) Representative immunoblot of A3G-expressing cell line 10 and stimulated and nonstimulated PBMCs. PBMCs were from three different donors. (B) Comparison of A3G expression levels in stable versus primary cells. Results are from three independent experiments, were normalized to tubulin, and are shown as average values ± standard deviations.
FIG. 3.
FIG. 3.
Mutant frequency analysis. The viral mutant frequency of vector virus produced from stable A3G-expressing cell lines is shown as the average of at least three separate experiments ± standard deviations. Expression levels of HSA and GFP in target cells were assayed by flow cytometry as described in Materials and Methods. Mutant frequency was calculated as follows: (HSA/GFP+)/[(HSA/GFP+) + (HSA+/GFP) + (HSA+/GFP+)]. Data for both Vif and Vif+ virus are shown.
FIG. 4.
FIG. 4.
G-to-A mutations in the HSA reporter gene. Stable A3G-expressing cell lines representing the low, middle, and high levels of expression were used. The percentages of G-to-A point mutations in the HSA gene (out of the total number of point mutations) for both Vif and Vif+ virus are shown. Results are from three independent experiments, and identical sequences from the same PCR analysis were counted only once.
FIG. 5.
FIG. 5.
Analysis of mutational load. The total number of point mutations per sequence from Vif + vector proviruses (A) or from Vif vector proviruses (B) was determined in the HSA reporter gene region. Individual sequences are represented as filled gray circles. The black horizontal bar represents the average number of mutations identified per sequence. The data are a summary of sequence data of at least 50 independent proviral sequences from each cell line and from a total of three independent experiments. Identical mutants from the same PCR were only counted once.
FIG. 6.
FIG. 6.
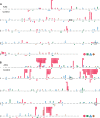
G-to-A mutation locations in the HSA reporter gene region. Mutation locations are shown for Vif + vector viruses (A) and Vif vector viruses (B). The start and stop codons of the HSA gene are indicated by sequences in boxes. Mutations observed in proviruses that were from infections of virus produced from A3G-expressing cell lines are shown above the sequence, while mutations in proviruses from infections of virus stocks made in the absence of A3G are shown below the sequence. Individual mutations are represented as colored dots.
FIG. 7.
FIG. 7.
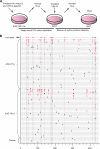
Rescue of HIV-1 vector infectivity after exposure to A3G. (A) Experimental protocol. Single-round replication-competent virus was generated as described in Materials and Methods and used to infect 293T cells. These cells were then transiently transfected with a VSV-G protein expression plasmid, and the cell culture supernatants were collected and used to infect fresh 293T cells. (B) Sequence analysis of the HSA reporter gene region from vector proviruses following the second round of viral replication. Individual sequences are displayed as horizontal lines. Eighty-three sequences with mutations are shown. The vertical dashes indicate mutation locations along the HSA gene sequence, as generated by the Hypermut program. Red vertical dashes represent G-to-A mutations, and black dashes represent all other point mutations. The first sequence line indicates the locations of all identified G-to-A hot spots from Fig. 6.

Similar articles

Cited by

References

    1. Bebenek, K., J. Abbotts, J. D. Roberts, S. H. Wilson, and T. A. Kunkel. 1989. Specificity and mechanism of error-prone replication by human immunodeficiency virus-1 reverse transcriptase. J. Biol. Chem. 264:16948-16956. - PubMed
    1. Bebenek, K., J. D. Roberts, and T. A. Kunkel. 1992. The effects of dNTP pool imbalances on frameshift fidelity during DNA replication. J. Biol. Chem. 267:3589-3596. - PubMed
    1. Bishop, K. N., M. Verma, E. Y. Kim, S. M. Wolinsky, and M. H. Malim. 2008. APOBEC3G inhibits elongation of HIV-1 reverse transcripts. PLoS Pathog. 4:e1000231. - PMC - PubMed
    1. Browne, E. P., C. Allers, and N. R. Landau. 2009. Restriction of HIV-1 by APOBEC3G is cytidine deaminase-dependent. Virology 387:313-321. - PMC - PubMed
    1. Cancio, R., S. Spadari, and G. Maga. 2004. Vif is an auxiliary factor of the HIV-1 reverse transcriptase and facilitates abasic site bypass. Biochem. J. 383:475-482. - PMC - PubMed

Publication types

Substances

LinkOut - more resources