

Associations among 25-hydroxyvitamin D, diet quality, and metabolic disturbance differ by adiposity in adults in the United States
- PMID: 20463091
- PMCID: PMC2913037
- DOI: 10.1210/jc.2010-0410
Associations among 25-hydroxyvitamin D, diet quality, and metabolic disturbance differ by adiposity in adults in the United States
Abstract
Context: Recent evidence indicates that a higher plasma level of 25-hydroxyvitamin D [25(OH)D] is associated with lower adiposity and a reduced number of metabolic disturbances (MetD).
Objectives: We examined associations among dietary quality, 25(OH)D, percent body fat (%BF), and MetD, and a pathway linking them, across central obesity.
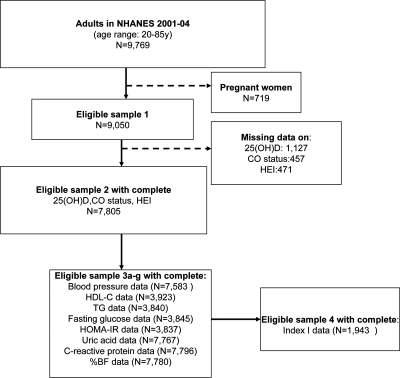
Design: This cross-sectional nationally representative study used extensive data from the National Health and Nutrition Examination Surveys of 2001-2004.
Participants: U.S. adults aged at least 20 yr were stratified by central obesity (CO) status. Sample sizes ranged from 1943 (all MetD combined) to 7796 (each component).
Main outcome measures: %BF was measured using dual-energy x-ray absorptiometry, and MetD was measured with individual continuous nonadiposity outcomes (e.g. fasting plasma glucose) and with a composite count index of binary MetD with prespecified cutoff points (Index I).
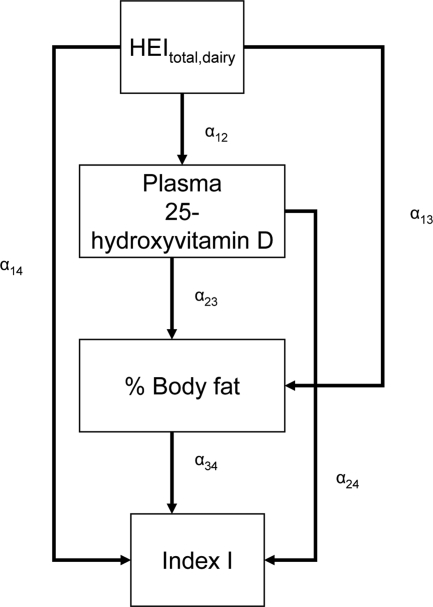
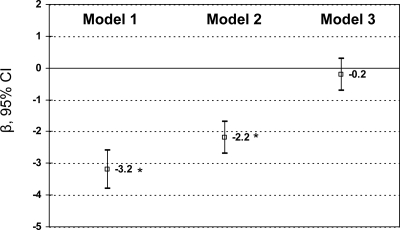
Results: A higher 25(OH)D was associated with better dietary quality, lower %BF, and lower number of MetD. These inverse 25(OH)D-%BF and 25(OH)D-MetD associations (i.e. fasting blood glucose, homeostatic model assessment of insulin resistance, C-reactive protein, and Index I) were significantly stronger among the CO+ group. Finally, the pathway linking the dairy component of the Healthy Eating Index (HEIdairy) to Index I through 25(OH)D and %BF indicated complete mediation among the CO- group, but HEIdairy and 25(OH)D had direct inverse associations with Index I among the CO+ group.
Conclusions: Due to potential genetic differences between CO- and CO+ groups, empowering U.S. adults with central obesity to make related behavioral changes may be especially effective in improving their vitamin D status and metabolic profile.
Figures
References
-
- Mølgaard C, Michaelsen KF 2003 Vitamin D and bone health in early life. Proc Nutr Soc 62:823–828 - PubMed
-
- Smith P, Barzel US 1984 Vitamin D deficiency osteomalacia in elderly persons. Compr Ther 10:24–32 - PubMed
-
- Rizzoli R, Eisman JA, Norquist J, Ljunggren O, Krishnarajah G, Lim SK, Chandler J 2006 Risk factors for vitamin D inadequacy among women with osteoporosis: an international epidemiological study. Int J Clin Pract 60:1013–1019 - PubMed
-
- Lips P 2007 Vitamin D status and nutrition in Europe and Asia. J Steroid Biochem Mol Biol 103:620–625 - PubMed
-
- Poole KE, Loveridge N, Barker PJ, Halsall DJ, Rose C, Reeve J, Warburton EA 2006 Reduced vitamin D in acute stroke. Stroke 37:243–245 - PubMed
Publication types
MeSH terms
Substances
Grants and funding
LinkOut - more resources
Full Text Sources
Medical
Research Materials
Miscellaneous
