. 2010 Jul;104(1):463-74.
doi: 10.1152/jn.00242.2010. Epub 2010 May 12.

Gamma band unit activity and population responses in the pedunculopontine nucleus

Affiliations

Gamma band unit activity and population responses in the pedunculopontine nucleus

Christen Simon et al. J Neurophysiol. 2010 Jul.

Abstract

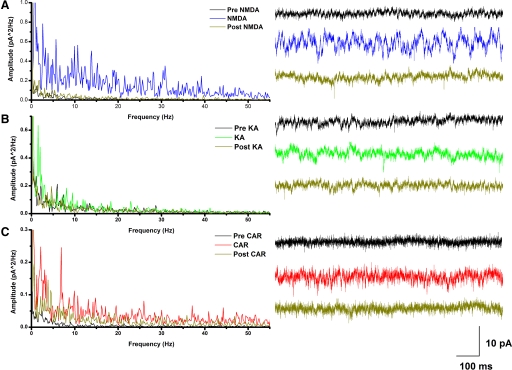
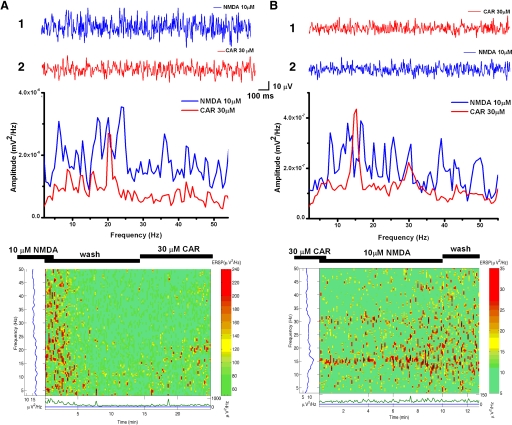
The pedunculopontine nucleus (PPN) is involved in the activated states of waking and paradoxical sleep, forming part of the reticular activating system (RAS). The studies described tested the hypothesis that single unit and/or population responses of PPN neurons are capable of generating gamma band frequency activity. Whole cell patch clamp recordings (immersion chamber) and population responses (interface chamber) were conducted on 9- to 20-day-old rat brain stem slices. Regardless of cell type (I, II, or III) or type of response to the nonselective cholinergic receptor agonist carbachol (excitation, inhibition, biphasic), almost all PPN neurons fired at gamma band frequency, but no higher, when subjected to depolarizing steps (50 +/- 2 Hz, mean +/- SE). Nonaccommodating neurons fired at 18-100 Hz throughout depolarizing steps, while most accommodating neurons exhibited gamma band frequency of action potentials followed by gamma band membrane oscillations. These oscillations were blocked by the sodium channel blocker tetrodotoxin (TTX), suggesting that at least some are mediated by sodium currents. Population responses in the PPN showed that carbachol induced peaks of activation in the theta and gamma range, while glutamatergic receptor agonists induced overall increases in activity at theta and gamma frequencies, although in differing patterns. Gamma band activity appears to be a part of the intrinsic membrane properties of PPN neurons, and the population as a whole generates different patterns of gamma band activity under the influence of specific transmitters. Given sufficient excitation, the PPN may impart gamma band activation on its targets.


Figures

Fig. 1.
Fig. 1.
Gamma band activity in whole cell recorded pedunculopontine nucleus (PPN) cells. A: increasing steps of current (increase of 30 pA per step, each step was 500 ms in duration, 2.5 s latency between each step, and the record was truncated between current steps and spliced to show only the current steps) caused cells to fire action potentials at higher frequencies. This cell fired maximally at 54 Hz, which is within the gamma frequency range. B: graph showing the average firing frequency of the 50 recorded cells at the beginning (black), middle (red), and end (green) of each current step. The average maximal firing frequency was at the 180 pA current step when cells fired at the average rate of 50 ± 2 Hz at the beginning of the current step. Cell firing frequency then decreased during the middle and end of the current step, and there was no significant difference between the firing rate during the middle and end of the stimulus (ns, P > 0.05). Significant compared with baseline is represented by an asterisk when P < 0.05, double asterisk when P < 0.01, and triple asterisk when P < 0.0001. C: graph showing the average firing frequency of each cell type at the beginning, middle, and end of the 180 pA current step. At the beginning of the current step, type I neurons (n = 17) fired significantly faster than type II (n = 16) or III (n = 16) cells (asterisk, P < 0.05), but type II and III neurons did not fire significantly faster than one another (ns, P > 0.05). Furthermore, there was no significant difference between the firing frequencies of the 3 cells types during the middle and end of the current step (ns, P > 0.05).
Fig. 2.
Fig. 2.
Membrane oscillations in PPN cells. A: some cells showed membrane oscillations during depolarizing current pulses. This is a PPN cell recording during a 500 ms, 180 pA current step, which caused membrane oscillations in this accommodating neuron. B: this power spectrum shows the frequency of the membrane oscillations. There was a clear peak at 35 Hz, indicating that these oscillations were in the gamma range. C: application of TTX (3 μM) blocked the membrane oscillations, indicating that they may be sodium channel dependent. D: there was no peak in the power spectrum following application of TTX, indicating that the membrane oscillations were blocked.
Fig. 3.
Fig. 3.
Gamma band activity induced in PPN cells by cholinergic and glutamatergic inputs. A: power spectrum and 1 s recordings of a whole cell patched PPN neuron prior to N-methyl-d-aspartate (NMDA; black record), during the NMDA peak effect (blue record), and following wash (yellow record). Application of NMDA induced oscillations as can be seen in the blue recording. However, the oscillations were not at a specific frequency and the power was increased at almost every frequency (including gamma). B: power spectrum and 1 s recordings of a PPN cell prior to kainic acid (KA; black record), during KA peak effect (green record), and following wash (yellow record). Application of KA induced oscillations in the theta range (green record, green line in power spectrum). C: power spectrum and 1 s recordings of a PPN neuron prior to carbachol (CAR; black record) during CAR peak effect (red record), and following wash (yellow record). Application of CAR increased the power of the oscillations at almost every frequency (red line), but there were also specific peaks in the theta and gamma range.
Fig. 4.
Fig. 4.
NMDA induced dose-dependent overall increase in PPN neuron activity. A: 20 s recordings of population responses at the beginning of each minute during control (black record), 10 μM NMDA (peak activity, blue record), and wash artificial cerebrospinal fluid (ACSF), yellow record], which were used to create a power spectrum (right). One second samples of these recordings are shown to the left of the power spectrum. Control, NMDA, and wash were tested in 4 different slices. B: dose-dependent effects of NMDA shown in the power spectrum on the right that includes 20 s recordings during the peak activity of 1 μM (light blue record), 5 μM (medium blue record), and 10 μM NMDA (dark blue record). Control, NMDA at each concentration, and wash were tested in 4 different slices. One second sample data are shown on the left, revealing a step-wise increase by concentration in overall activity at almost all frequencies ranging from theta to gamma.
Fig. 5.
Fig. 5.
KA increased overall activity while simultaneously increasing oscillations at gamma frequencies. A: 1 s sample of data (left) and power spectrum (right) of oscillatory activity generated by 2 μM KA (green record), and return of the oscillatory activity to normal background noise level after wash (ACSF, yellow record), similar to that in the control (black record) condition. One second sample recordings are shown to the left of the power spectrum. The power spectrum was taken at minute 4, which is the same as the minute 4 time point in the event related spectral perturbation (ERSP) below. Control, KA, and wash were tested in 4 different slices. B: autocorrelation of 20 s sample of oscillatory activity generated by 2 μM KA compared with the control condition did not show rhythmic correlation in this slice. C: MatLab graph of ERSP generated using all (n = 11 time points) 20 s recordings taken during 10 min perfusion with 2 μM KA that began at the start of the plot. Data showed that the peak effect of KA was between minute 4 (the minute 4 power spectrum shown in A above is equivalent to a vertical sample of the ERSP at minute 4) and minute 8 min after the beginning of drug application with a gradual reduction of activity in last few recordings (∼11–12 min). During the peak effect, KA induced oscillations at different frequencies, with power spectra showing a complex free-running rhythm. That is, peaks of activation present at low frequencies gradually increased to achieve higher frequencies, while peaks of activity at high frequencies also increased gradually to achieve even higher frequencies.
Fig. 6.
Fig. 6.
CAR induced specific peaks at gamma frequency. A: 1 s sample data (left) and power spectrum (right) shows a 20 s recording of oscillatory activity (peaks at 17 and 34 Hz) induced by 30 μM CAR (red record), compared with control (black record) and wash (yellow record). Control, CAR, and wash were tested in 4 different slices. B: autocorrelation of CAR recording vs. control clearly shows that rhythmic oscillations were induced in PPN neurons when stimulated with CAR. C: the MatLab graph of ERSP shows that peaks at 17 and 34 Hz were induced beginning at minute 4 after the start of CAR perfusion. The effect persisted after the end of CAR perfusion (minute 10), but returned to control levels by 15 min of wash (not shown). The power spectrum in A was taken at minute 5 after the beginning of CAR application and represents a vertical sample of the ERSP at minute 5.
Fig. 7.
Fig. 7.
NMDA and CAR generated characteristic oscillatory activities when applied successively regardless of the order of drug application. A: 1 s sample data (top) at peak of 10 μM NMDA when applied 1st (1, blue record), and at peak of 30 μM CAR when applied 2nd (2, red record). Power spectrum (middle) shows how oscillatory activities at almost all frequencies (theta through gamma) were generated at the peak of the NMDA effect (blue record) but were replaced by oscillations at specific gamma frequencies at the peak of the CAR effect (red record). The MatLab graph (bottom) shows the entire 25 min recording beginning during wash after 10 μM NMDA (which had induced overall activation) but was replaced by 30 μM CAR, which, after 5 min, induced peaks of activity in the gamma range. Basically, the tissue was washed in ACSF (min 0–14) and 30 μM CAR added at minute 14. B: 1 s sample data (top), and power spectrum (middle) show gamma oscillations (15 and 30 Hz) were induced by 30 μM CAR (red record) while addition of NMDA (blue record) without wash induced overall increases in frequencies of activity. Please note that the scales in A, 1 and 2, are higher than in B, 1 and 2, including the ERSP activity levels in the 2 slices. MatLab graph (bottom) shows a 13 min recording during which CAR (30 μM) had induced specific peaks at 15 and 30 Hz but were replaced within 4–5 min after application of NMDA (10 μM) without wash by increases in overall activity at frequencies ranging from theta to gamma. Note that the CAR (min 0–10) effect was still present at minute 6 when NMDA began increasing overall activity.

Similar articles

Cited by

References

    1. Azouz R, Gray CM, Nowak LG, McCormick DA. Phsyiological properties of inhibitory interneurons in cat striate cortex. Cereb Cortex 7: 534–545, 1997 - PubMed
    1. Barraza D, Hitoshi K, Wilson C. Slow spike frequency adaptation in neurons of the rat subthalamic nucleus. J Neurophysiol 102: 3689–3697, 2009 - PMC - PubMed
    1. Brown RE, Winston S, Basheer R, Thakkar MM, McCarley RW. Electrophysiological characterization of neurons in the dorsolateral pontine rapid-eye-movement sleep induction zone of the rat: intrinsic membrane properties and responses to carbachol and orexins. Neuroscience 143: 739–755, 2006 - PMC - PubMed
    1. Cunningham MO, Whittington MA, Bibbig A, Roopun A, LeBeau FE, Vogt A, Monyer H, Buhl EH, Traub RD. A role for fast rhythmic bursting neurons in cortical gamma oscillations in vitro. Proc Nat Acad Sci USA 101: 7152–7157, 2004 - PMC - PubMed
    1. Datta S. Evidence that REM sleep is controlled by the activation of brain stem pedunculopontine tegmental kainate receptor. J Neurophysiol 87: 1790–1798, 2002 - PubMed

Publication types

MeSH terms

LinkOut - more resources