. 2010 May 12;30(19):6527-37.
doi: 10.1523/JNEUROSCI.1625-09.2010.

A relative position code for saccades in dorsal premotor cortex

Affiliations

A relative position code for saccades in dorsal premotor cortex

Bijan Pesaran et al. J Neurosci. .

Abstract

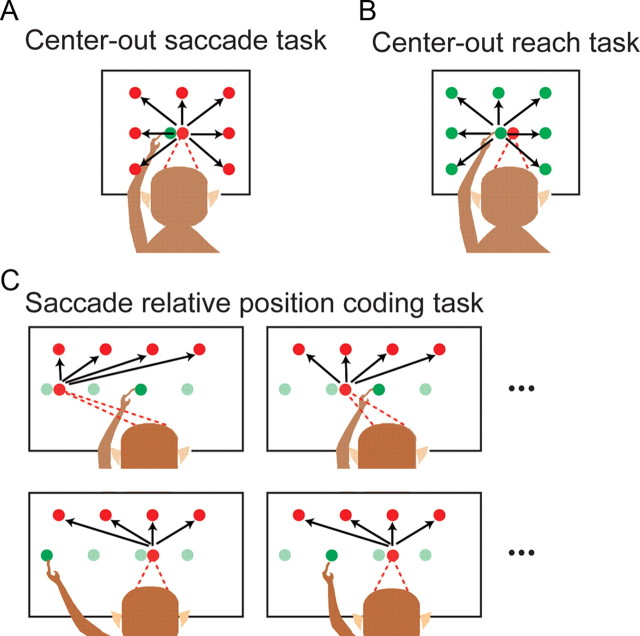
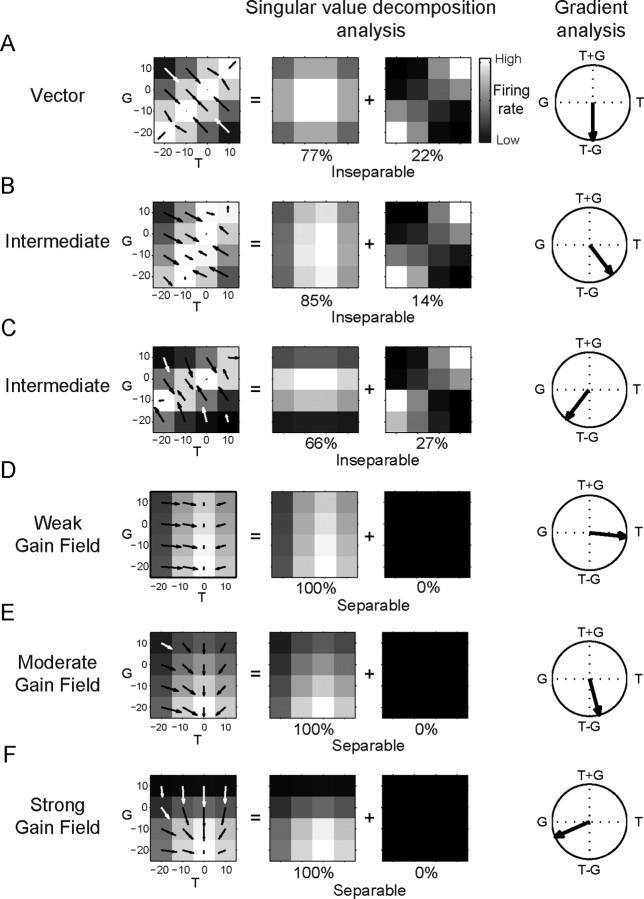
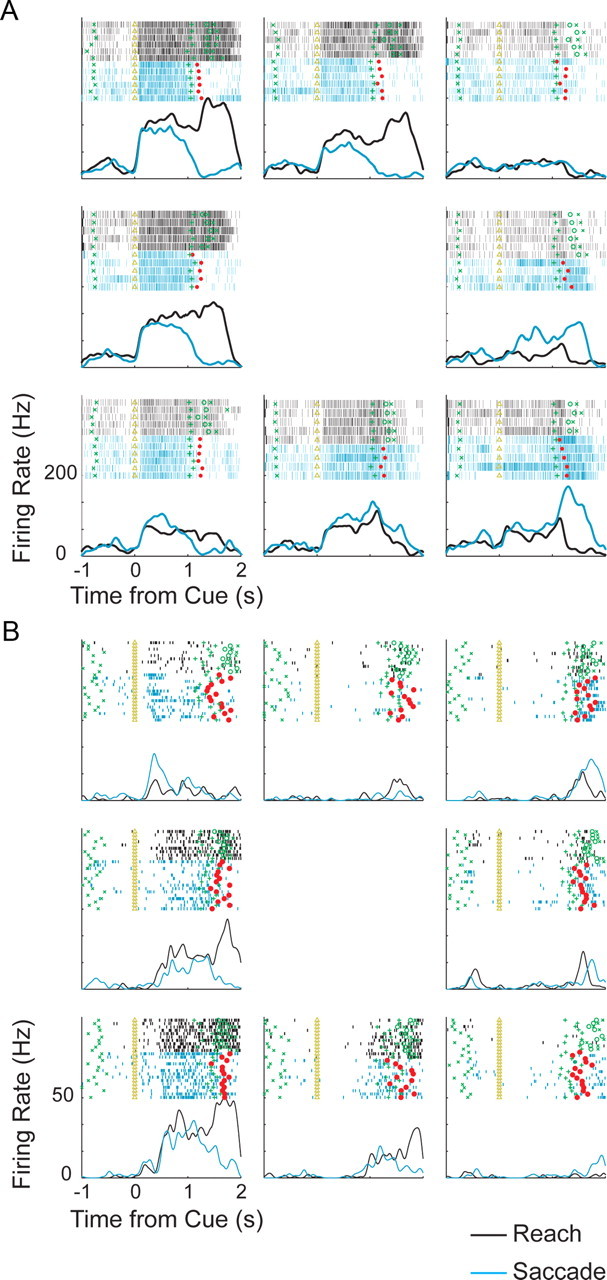
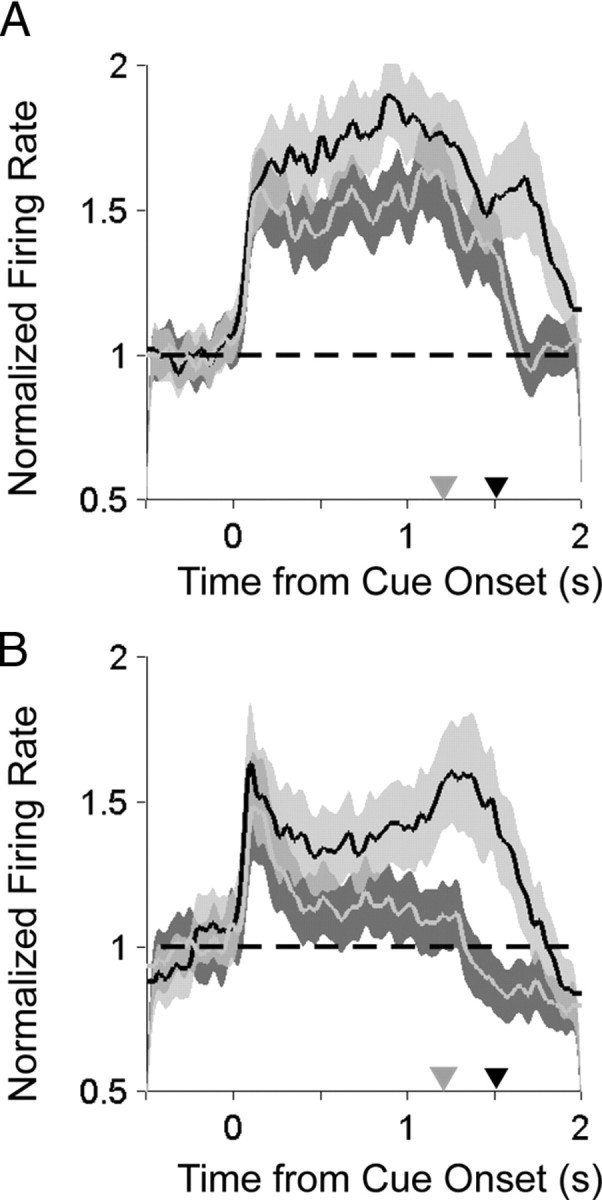
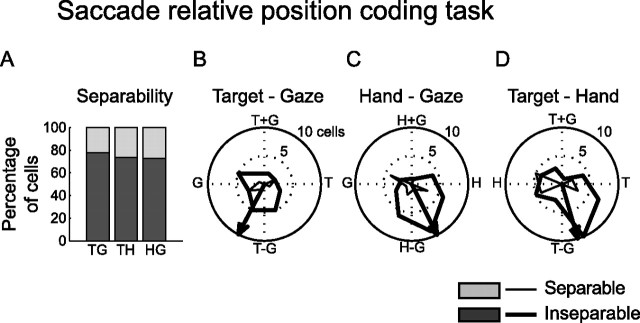
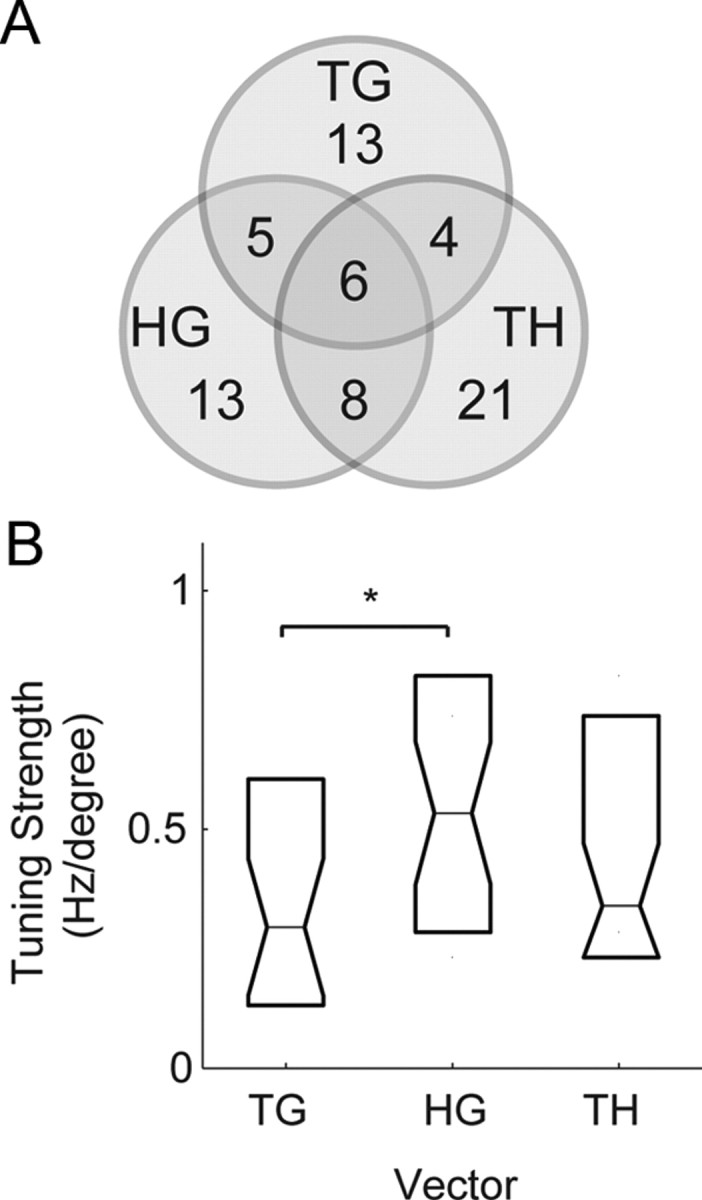
Spatial computations underlying the coordination of the hand and eye present formidable geometric challenges. One way for the nervous system to simplify these computations is to directly encode the relative position of the hand and the center of gaze. Neurons in the dorsal premotor cortex (PMd), which is critical for the guidance of arm-reaching movements, encode the relative position of the hand, gaze, and goal of reaching movements. This suggests that PMd can coordinate reaching movements with eye movements. Here, we examine saccade-related signals in PMd to determine whether they also point to a role for PMd in coordinating visual-motor behavior. We first compared the activity of a population of PMd neurons with a population of parietal reach region (PRR) neurons. During center-out reaching and saccade tasks, PMd neurons responded more strongly before saccades than PRR neurons, and PMd contained a larger proportion of exclusively saccade-tuned cells than PRR. During a saccade relative position-coding task, PMd neurons encoded saccade targets in a relative position code that depended on the relative position of gaze, the hand, and the goal of a saccadic eye movement. This relative position code for saccades is similar to the way that PMd neurons encode reach targets. We propose that eye movement and eye position signals in PMd do not drive eye movements, but rather provide spatial information that links the control of eye and arm movements to support coordinated visual-motor behavior.


Figures

Figure 1.
Figure 1.
Behavioral tasks. A, Center-out task for saccades involved the monkey touching a central target while making a saccade from an adjacent location to one of eight peripheral targets arranged on a square spaced 10°. The lower target is not shown for clarity. B, Center-out task for reaches involved the monkey fixating a central target while making a reach from an adjacent location. C, Saccade relative position-coding task. A saccade is made from one of four initial gaze positions on a line to one of four target positions while a touch is maintained at one of four hand positions on a touch screen. Hand positions and reach targets are shown in green, and gaze positions and saccade targets are shown in red.
Figure 2.
Figure 2.
Example simulated responses and analysis. A, Vector response field f(G, T) = f(TG) decomposed by singular value decomposition analysis and gradient analysis. The first two matrix responses in the singular value decomposition are shown. The fraction of the total variance they capture is given beneath each matrix. The response field orientation from the gradient analysis is shown on the rightmost column. B, Intermediate response field. f(G, T) = f(TG/2). C, Intermediate response field. f(G, T) = f(T − 2G). D, Weak gain field of eye position modulating target position coding. E, Moderate eye position gain field. F, Strong eye position gain field. White, High firing rate. Black, Low firing rate. For the response field orientation, 0° points right and angles increase counterclockwise.
Figure 3.
Figure 3.
Example PMd cell responses. A, Rasters and peristimulus time histograms for activity of an example cell to a reach without a saccade (black) and a saccade without a reach (blue). Time of the cue onset (triangle), end of delay period (green cross), saccade onset time (red square), reach start time (green circle), and reach end time (green x) are shown. B, Same as A for another PMd cell.
Figure 4.
Figure 4.
Comparison of saccade- and reach-related activity during the center-out tasks. A, Population average normalized histograms aligned to target onset for reaches (black) and saccades (gray) to the preferred direction. Gray triangle, Mean time of saccade; black triangle, mean time of reach endpoint. B, Same for PRR.
Figure 5.
Figure 5.
Population histograms preferred directions of PMd neurons. A, Histogram of preferred direction of activity during delay period before saccades. B, Histogram of preferred direction of activity during delay period before reaches. C, Histogram of difference in preferred directions during delay periods before saccades and reaches. Asterisk marks the mean preferred direction difference. Preferred directions before a reach and saccade point in similar directions.
Figure 6.
Figure 6.
A, B, Idealized cell responses and formal models for gaze-centered (A) and relative position-coding (B) cells. The idealized gaze-centered cell response shown is modeled as a gain field of hand position modulating target–gaze vector coding. In the formal model, an additional gain field of gaze position can affect the cell's firing rate as well. The idealized relative position-coding cell response shown is modeled as hand–gaze, target–gaze, and target–hand position tuning. In the formal model, gain fields of gaze position and hand position can also affect the cell's firing rate as well. The response field orientation from the gradient analysis (see Results and Methods) is shown for each idealized cell. 0° points right and angles increase counterclockwise. White, High firing rate. Black, Low firing rate.
Figure 7.
Figure 7.
PMd example cell responses to the saccade relative position-coding task. Activity is aligned to target onset (black square) as gaze position is varied (rows), hand position is varied (columns), and target position is varied (within each panel). Gaze (G), hand (H), and target (T) positions are shown above each panel. Spike rasters are shown above the panel color coded for each target position in that panel. Target onset time (black square) and mean saccade time (gray square) are shown on each panel. Horizontal bars on the top left panel indicate the baseline and delay period analysis intervals.
Figure 8.
Figure 8.
PMd example cell response matrices during the saccade relative position-coding task. A, Target–gaze response matrix during the delay period at the peak of the response field. The hand is at −20°. Arrows show the two-dimensional gradient elements. B, C, Similar for hand–gaze and target–hand response matrices with the target at −20° and gaze at 10°, respectively. D, Overall response field orientation for the TG response matrix, −144°. E, Overall response field orientation for the HG response matrix, −56°. F, Overall response field orientation for the TH response matrix, −101°. 0° points right and angles increase counterclockwise.
Figure 9.
Figure 9.
Population gaze–hand–target analysis during the delay period. A, Population separability for all PMd cells with tuned delay or movement period responses. The percentage of inseparable cells is show in dark gray. The percentage of separable cells is shown in light gray. B–D, Target–gaze response field orientation (B), hand-gaze response field orientation (C), and target–hand response field orientation (D) for tuned PMd neurons. Orientations for separable cells are shown in thick lines. Orientations for inseparable cells are shown in thin lines.
Figure 10.
Figure 10.
PMd delay period responses during the saccade relative position-coding task. A, Venn diagram of the number of neurons with tuned inseparable TG, TH, and HG responses during the saccade relative position-coding task. B, Tuning strength of the saccade response matrices. *Significant difference (p < 0.05).

Similar articles

Cited by

References

    1. Batschelet E. Circular statistics in biology. New York: Academic; 1981.
    1. Battaglia-Mayer A, Ferraina S, Genovesio A, Marconi B, Squatrito S, Molinari M, Lacquaniti F, Caminiti R. Eye-hand coordination during reaching. II. An analysis of the relationships between visuomanual signals in parietal cortex and parieto-frontal association projections. Cereb Cortex. 2001;11:528–544. - PubMed
    1. Battaglia-Mayer A, Mascaro M, Caminiti R. Temporal evolution and strength of neural activity in parietal cortex during eye and hand movements. Cereb Cortex. 2007;17:1350–1363. - PubMed
    1. Blohm G, Crawford JD. Computations for geometrically accurate visually guided reaching in 3-D space. J Vis. 2007;7:4.1–4.22. - PubMed
    1. Blohm G, Keith GP, Crawford JD. Decoding the cortical transformations for visually guided reaching in 3D space. Cereb Cortex. 2009;19:1372–1393. - PubMed

Publication types