. 2010 May 12;30(19):6559-76.
doi: 10.1523/JNEUROSCI.3701-09.2010.

Nicotinamide adenine dinucleotide-dependent binding of the neuronal Ca2+ sensor protein GCAP2 to photoreceptor synaptic ribbons

Affiliations

Nicotinamide adenine dinucleotide-dependent binding of the neuronal Ca2+ sensor protein GCAP2 to photoreceptor synaptic ribbons

Jagadeesh Kumar Venkatesan et al. J Neurosci. .

Abstract

Guanylate cyclase activating protein 2 (GCAP2) is a recoverin-like Ca2+-sensor protein known to modulate guanylate cyclase activity in photoreceptor outer segments. GCAP2 is also present in photoreceptor ribbon synapses where its function is unknown. Synaptic ribbons are active zone-associated presynaptic structures in the tonically active photoreceptor ribbon synapses and contain RIBEYE as a unique and major protein component. In the present study, we demonstrate by various independent approaches that GCAP2 specifically interacts with RIBEYE in photoreceptor synapses. We show that the flexible hinge 2 linker region of RIBEYE(B) domain that connects the nicotinamide adenine dinucleotide (NADH)-binding subdomain with the substrate-binding subdomain (SBD) binds to the C terminus of GCAP2. We demonstrate that the RIBEYE-GCAP2 interaction is induced by the binding of NADH to RIBEYE. RIBEYE-GCAP2 interaction is modulated by the SBD. GCAP2 is strongly expressed in synaptic terminals of light-adapted photoreceptors where GCAP2 is found close to synaptic ribbons as judged by confocal microscopy and proximity ligation assays. Virus-mediated overexpression of GCAP2 in photoreceptor synaptic terminals leads to a reduction in the number of synaptic ribbons. Therefore, GCAP2 is a prime candidate for mediating Ca2+-dependent dynamic changes of synaptic ribbons in photoreceptor synapses.


Figures

Figure 1.
Figure 1.
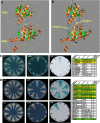
RIBEYE interacts with GCAP2 in the YTH system. A, Sequence of bovine GCAP2 given in the single letter amino acid code. The four EF- hands of GCAP2 are indicated in color. EF-hand 1 (yellow) is nonfunctional and does not bind Ca2+; EF-hands 2–4 (green) are functional and bind Ca2+. The bold bar that underlines the schematic drawing of GCAP2 denotes the extension of the initially obtained GCAP2 prey clone (also in D, prey 4). Glycine G2 (gray) is myristoylated in situ. B, Schematic domain depiction of RIBEYE. RIBEYE consists of an N-terminal A domain and a C-terminal B domain. The B domain can be further subdivided into a contiguous central NBD and a discontinuous SBD. The SBD consists of two sequence stretches, SBDa and SBDb, that are linked to the NBD via two flexible hinge regions, hinge 1 and hinge 2 (see also Figs. 2A,B, 8D,E; supplemental Fig. 2A, available at www.jneurosci.org as supplemental material). The structure model of RIBEYE(B) (see Fig. 2A,B) (Alpadi et al., 2008; Magupalli et al., 2008) covers the region from amino acids 575 to 905 of RIBEYE. The hydrophobic C-terminal region of RIBEYE(B) ranging from amino acids 912 to 988 is denoted as the CTR of RIBEYE in the text. C, GCAP2 interacts with RIBEYE(B) [RE(B)] in the YTH system. Summary plates of YTH analyses obtained with the indicated bait and prey plasmids are shown. For convenience, experimental bait–prey pairs are shown in color (green, interacting bait–prey pairs; yellow, noninteracting bait–prey pairs); control matings are not colored. RIBEYE(B) interacts with GCAP2 as judged by growth on selective plates (−ALWH) and expression of β-galactosidase (β-gal) activity (yeast matings 4, 7, 13, 16, 19, and 22). The respective control matings (autoactivation controls; yeast matings 2, 3, 5, 6, 8–11, 14, 15, 17, 18, 20, 21, 23, 24) did not show growth on the −ALWH plate and no expression of β-galactosidase activity. Growth on −LW plates demonstrates the presence of the bait and prey plasmids in the mated yeasts. Full-length GCAP2 containing an intact myristoylation site did not interact with RIBEYE(B) (mating 1) because the myristoylation prevents the entry of the prey protein into the nucleus (see text). If the myristoylation signal is deleted by a point mutation (G2A), full-length GCAP2 also interacts with RIBEYE(B) (supplemental Fig. 1A, available at www.jneurosci.org as supplemental material). Similarly, deleting the myristoylation signal by truncation of the first two amino acids also results in interaction between RIBEYE(B) and GCAP2 (mating 4). Mating 12 is an unrelated positive control mating (Alpadi et al., 2008). D, Schematic summary of the mapping analyses obtained with the YTH system. RIBEYE(B) interacts with all tested GCAP2 constructs except for full-length GCAP2 that contains an intact myristoylation signal (prey 1). If the myristoylation signal is deleted by a point mutation (G2A) (prey 2), full-length GCAP2 also interacts with RIBEYE(B) (supplemental Fig. 1A, available at www.jneurosci.org as supplemental material). ALWH, Dropout medium lacking adenine, leucine, tryptophan, and histidine; LW, dropout medium lacking leucine and tryptophan.
Figure 2.
Figure 2.
GCAP2 interacts with the flexible hinge 2 region of RIBEYE(B) [RE(B)] but not with the NBD and SBD alone. A, B, Structure model of the B domain of RIBEYE based on the crystal structure of tCtBP1 (Kumar et al., 2002; Nardini et al., 2003; see also Alpadi et al., 2008; Magupalli et al., 2008). The structure model covers large parts of the B domain [RE(B)575-905]. The B domain of RIBEYE consists of an NBD and an SBD, which are connected by two flexible hinge regions, hinge 1 and hinge 2 (blue). The dotted lines indicate the extensions of the hinge 1 and hinge 2 constructs tested in D with the YTH system. C, GCAP2 does not interact with the NBD of RIBEYE(B) or the SBD of RIBEYE(B). Summary plates of YTH analyses obtained with the indicated bait and prey plasmids. For convenience, experimental bait–prey pairs are underlayered in color (green, interacting bait–prey pairs; yellow, noninteracting bait–prey pairs); control matings are not colored. GCAP2 interacts with intact RIBEYE(B) as judged by growth on selective plates (−ALWH) and expression of β-galactosidase (β-gal) activity (yeast mating 1; positive control). In contrast, GCAP2 does not interact either with the NBD (mating 2) or the SBD (mating 3) of RIBEYE alone. The respective control matings (autoactivation controls; yeast matings 4-11) did not show growth on −ALWH plates and no expression of β-galactosidase activity. Growth on −LW plates demonstrates the presence of the bait and prey plasmids in the mated yeasts. D, GCAP2 interacts with the hinge 2 region of RIBEYE(B). Summary plates of YTH analyses obtained with the indicated bait and prey plasmids. For convenience, experimental bait–prey pairs are underlayered in color (green, interacting bait–prey pairs; yellow, noninteracting bait–prey pairs); control matings are not colored. GCAP2 interacts with the hinge 2 region of RIBEYE(B) [RE(B)856-891, yeast matings 3, 6, 9] but not with the hinge1 region of RIBEYE(B) [RE(B)663-691, yeast matings 2, 5, 8] as judged by growth on selective plates (−ALWH) and expression of β-galactosidase activity. The respective control matings (autoactivation controls; yeast matings #10-21) did not show growth on -ALWH plate and expression of β-galactosidase activity. Growth on −LW plates demonstrates the presence of the bait and prey plasmids in the mated yeasts. Matings 1, 4, and 7 represent positive control matings [RE(B)–GCAP2; see also Fig. 1]. Mating 22 represents an unrelated positive control mating (Alpadi et al., 2008). N, N terminus; C, C terminus. ALWH, Dropout medium lacking adenine, leucine, tryptophan, and histidine; LW, dropout medium lacking leucine and tryptophan.
Figure 3.
Figure 3.
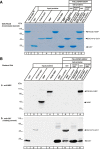
GCAP2 interacts with RIBEYE(B) [RE(B)] in protein pull-down analyses. GCAP2-GST and GST alone (control protein) were used as immobilized bait proteins, and RIBEYE(B)-MBP and MBP alone (control protein) as soluble prey proteins. After incubation and subsequent washing of the immobilized proteins, binding of the soluble prey proteins to the immobilized bait proteins was tested by SDS-PAGE (10% polyacrylamide gels; A) or Western blotting with the indicated antibodies (B). A, RIBEYE(B)-MBP binds to GCAP2-GST (lane 9, arrowhead) but not to GST alone (lane 8). MBP alone does not bind to either GCAP2-GST (lane 7) or GST alone (lane 6). Fifteen percent of the total proteins were loaded in the input lanes (lanes 2–5); 100% of the immobilized protein pellets were loaded (lanes 6–9). Eight percent of the unbound fraction (marked by asterisk) was loaded in lane 1. Ba, RIBEYE(B)-MBP binds to GCAP2-GST (lane 8, arrowhead) but not to GST alone (lane 7). Bb, The same blot as in Figure Ba but after stripping and reprobing of the nitrocellulose with anti-GST antibodies to show equal loading of bait proteins. In Ba and Bb, 10% of the input (lanes 1–4) was loaded. Always 100% of the immobilized protein pellets were loaded (lanes 5–8).
Figure 4.
Figure 4.
Coimmunoprecipitation of RIBEYE and GCAP2 from the bovine retina. Aa, GCAP2 immune serum and GCAP2 preimmune serum were tested for their capability to coimmunoprecipitate RIBEYE. The experiments were analyzed by SDS-PAGE (12.5% polyacrylamide gels) followed by Western blotting (WB) with the indicated antibodies. RIBEYE is coimmunoprecipitated by GCAP2 immune serum (lane 2, arrowhead) but not by GCAP2 preimmune serum (lane 1). Ab, The same blot as in Aa but reprobed with rabbit polyclonal anti-GCAP2 antibodies. This blot shows the presence of GCAP2 precipitated by the immune serum (lane 2, arrowhead) but not by the preimmune serum (lane 1). Asterisks indicate the immunoglobulin heavy chains. B, RIBEYE immune serum and RIBEYE preimmune serum were tested for their capability to coimmunoprecipitate GCAP2. The experiments were analyzed by SDS-PAGE (12.5% polyacrylamide gels) followed by Western blotting with the indicated antibodies. GCAP2 is coimmunoprecipitated by RIBEYE immune serum (Ba, lane 2, arrowhead) but not by RIBEYE preimmune serum (Ba, lane 1). Bb, The same blot as in Ba but reprobed with polyclonal anti-RIBEYE (U2656). RIBEYE was immunoprecipitated by the RIBEYE immune serum (lane 2, arrowhead) but not by the RIBEYE preimmune serum (lane 1). Asterisks indicate the immunoglobulin heavy chains. Bc, The same blot as in Bb but reprobed with mouse monoclonal anti-CtBP2 antibodies which detect the B domain of RIBEYE. Similar to Bb, this blot also shows the presence of RIBEYE precipitated by the RIBEYE immune serum (lane 2) but not by the RIBEYE preimmune serum (lane 1). In addition to RIBEYE, an additional protein at ∼50 kDa is present in the experimental precipitate (lane 2) but not in the control immunoprecipitate (lane 1). This 50 kDa band very likely is CtBP2 (Bc, lane 2, circle). Purified synaptic ribbons contain RIBEYE and CtBP1 but not CtBP2 (K.S. and F.S., unpublished data). In the input lanes (lane 3), 0.5% of total input was loaded in A, and 1% of total input in B. The immunoprecipitates are always 100%. In the input lanes (“bovine retina lysate”; A, B, lane 3), RIBEYE is only visible as a faint band because RIBEYE is not a major protein in the crude retinal lysate prepared as described in Materials and Methods, and only a limited amount of protein can be loaded on a single lane. The “bovine retina lysate” contains the Triton X-soluble supernatant after tissue extraction and spinning at 13,000 rpm (30 min, 4°C; see Materials and Methods). RIBEYE is strongly enriched in the experimental immunoprecipitates (Aa, Bb, Bc, lane 2). Lane 4 in Ab serves as positive control. In A, lane 4 is loaded with (total) bovine retina boiled in sample buffer; in B, lane 4 is loaded with purified synaptic ribbons. IP, Immunoprecipitation.
Figure 5.
Figure 5.
GCAP2 colocalizes with synaptic ribbons in photoreceptor ribbon synapses (as analyzed by conventional epifluorescence microscopy). A–E, Immunolabeling of the bovine retina with rabbit polyclonal antibodies against GCAP2 (A–C) and mouse monoclonal antibodies against RIBEYE(B)/CtBP2 (B, C), or mouse monoclonal antibodies against GCAP2 (clone A1; Santa Cruz Biotechnology) and rabbit polyclonal antibodies against RIBEYE (U2656) (D, E). Both the polyclonal (A–C) as well as the monoclonal (D) GCAP2 antibodies generated a strong immunolabel particularly in the inner segments (ISs) of bovine photoreceptor cells. In addition, the OPL that contains photoreceptor ribbon synapses is strongly labeled by the polyclonal (A–C) and monoclonal GCAP2 antibodies (D, E). The OPL, which is immunolabeled by the GCAP2 antibodies, is labeled by arrows in A and B. The GCAP2 immunosignal colocalized with synaptic ribbons, which were visualized by immunolabeling with RIBEYE antibodies (B–E, arrows). Strong immunosignals of GCAP2 were found at synaptic ribbons and in close vicinity to synaptic ribbons. Most, but not all, ribbons colocalized with GCAP2. The arrowhead in C denotes synaptic ribbons that were not associated with detectable amounts of GCAP2. F, The GCAP2 immunosignal in the OPL mostly colocalizes with the immunosignal of synaptophysin, a marker protein of synaptic vesicles highly enriched in the presynaptic terminals (arrow). Virtually identical results as described above for the bovine retina were also obtained for the mouse retina (Fig. 6; supplemental Fig. 8, available at www.jneurosci.org as supplemental material). OS, Outer segment; IPL, inner plexiform layer. Scale bars: A, B, D, 15 μm; C, E, F, 10 μm.
Figure 6.
Figure 6.
GCAP2 colocalizes with synaptic ribbons in photoreceptor ribbon synapses (as analyzed by confocal laser scanning fluorescence microscopy). A, B, Immunolabeling of the mouse retina with rabbit polyclonal antibodies against GCAP2 and mouse monoclonal antibodies against RIBEYE(B)/CtBP2 as analyzed by confocal laser scanning microscopy. GCAP2 colocalizes with synaptic ribbons that are immunolabeled with antibodies against RIBEYE. Arrows point to examples of RIBEYE-labeled synaptic ribbons that are also immunoreactive for GCAP2. INL, inner nuclear layer. Scale bars: 5 μm.
Figure 7.
Figure 7.
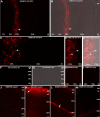
Colocalization of RIBEYE and GCAP2 as analyzed by in situ PLAs. Colocalization of RIBEYE and GCAP2 in retinal sections in situ was analyzed using proximity ligation assays (Gustafsdottir et al., 2005; Söderberg et al., 2008). This assay critically depends on the distance of the interaction partners and a positive PLA interaction signal is only generated if the interaction partners are located in a distance of <40 nm (Söderberg et al., 2006). A–E, A strong PLA interaction signal in the OPL, as visualized by the red fluorescence signal, was observed between RIBEYE and GCAP2. A, B, An overview of the PLA signals is given at a low magnification. C–E, High-magnifications of the OPL. In B and E, the PLA signals of A and D are superimposed onto the respective phase images. Arrows point to PLA interaction signals in the OPL indicating close proximity of RIBEYE and GCAP2. F–I, No PLA interaction signal was present in the OPL if both primary antibodies were omitted (F, G) or if only one primary antibody was applied (H, I), demonstrating the specificity of the detection assay. G, The PLA signal of F is superimposed onto the respective phase image. J, As an additional negative control, RIBEYE and opsin were tested for interaction by PLA and did not produce any signal in the OPL, again demonstrating specificity of the PLA interaction assays. K, L, In contrast, a mixture of RIBEYE (U2656)/CtBP2 antibodies (positive control) gave a strong PLA interaction signal in the OPL (L). A mixture of GCAP2/opsin antibodies generated a strong PLA interaction signal in the outer/inner segments (ISs) but not in the OPL (K). M, RIBEYE and mGluR6, which are located relatively closely together but beyond the critical distance of PLAs of ∼40 nm (Söderberg et al., 2006), did not produce a PLA interaction signal in the OPL, demonstrating that PLA interaction signals clearly indicate very close proximity of the analyzed antigens. Arrows in K and L point to PLA interaction signals. INL, inner nuclear layer; IPL, inner plexiform layer. Scale bars: A–M, 10 μm.
Figure 8.
Figure 8.
The binding of GCAP2 to the hinge 2 region of RIBEYE(B) [RE(B)] is modulated by the SBD of RIBEYE(B). A, B, Fusion protein pull-down assays analyzed by SDS-PAGE (10% acrylamide gels). A, GCAP2 does not pull down both wild-type RE(B) or RE(B)C683S in the absence of βME (lanes 8, 10) but only if βME is present (lanes 7, 9; arrowheads). B, In contrast, GCAP2 pulls down RIBEYE(B)C899S in the absence of βME (lane 8, arrowhead). C, Point-mutating F904 in RIBEYE(B) to RE(B)F904W abolishes RIBEYE(B)–GCAP2 interaction in the YTH system (mating 1). Similarly, deleting the hydrophobic CTR of RIBEYE(B) results in a lack of interaction between RIBEYE and GCAP2 in the YTH system (mating 7). D, Localization of cysteine residues in RIBEYE(B). Only cysteine C667 and cysteine C899 are located within a distance of ∼4 Å to form a disulfide bridge (indicated by overlapping black circles). E, A predicted disulfide bridge between C667 in SBDa and C889 in SBDb (white circle) can be expected to limit the rotational freedom of the hinge 2 region and the movement of the SBDb relative to SBDa (black, curved arrow). The structure model in D and E starts at amino acid P575 and ends at amino acid F905 of RIBEYE, and is based on the crystal structure of tCtBP1 (Kumar et al., 2002; Nardini et al., 2003; see also Alpadi et al., 2008; Magupalli et al., 2008). ALWH, Dropout medium lacking adenine, leucine, tryptophan, and histidine; LW, dropout medium lacking leucine and tryptophan.
Figure 9.
Figure 9.
NADH and NAD+ are essential cofactors for the binding between RIBEYE and GCAP2 in the absence of βME. In the fusion protein pull-down analyses the fusion proteins were used at an equimolar concentration of 0.8 μm. Fusion protein pull-down assays were analyzed by SDS-PAGE (10% acrylamide gels). RIBEYE(B) [RE(B)] binds NADH with high affinity (Schmitz et al., 2000). A, B, In fusion protein pull-down assays, GCAP2–RIBEYE(B) interaction requires the presence of βME. If βME is absent, GCAP2 does not bind to RIBEYE(B) unless NADH or NAD+ is added to the incubation buffer. Both the reduced form (NADH) (A) as well as the oxidized form (NAD+; B) promote RIBEYE(B)–GCAP2 interaction. C, D, Low concentrations of NADH promote RIBEYE/GCAP2 interaction. We tested whether low concentrations of NADH (C) or NAD+ (D) [ranging from 0.001 μm (1 nm) to 0.1 μm (100 nm)] were able to stimulate binding of RIBEYE to GCAP2 in the absence of βME. NAD+/NADH promoted RIBEYE(B)–GCAP2 binding already at concentrations as low as 10 nm (C, D, lane 4). If still lower concentrations of NADH were used, i.e., 1 and 5 nm (C, D, lanes 2, 3, respectively), interaction was no longer observed, similar to the absence of interaction in the absence of any NADH (C, lane 1) or NAD+ (D, lane 1). The incubation buffer in the experiments shown above (A–D) did not contain any βME. E, To further evaluate the importance of NADH in promoting RIBEYE(B)–GCAP2 interaction, we analyzed the NADH-binding-deficient RIBEYE point mutant, RIBEYE(B)G730A (Alpadi et al., 2008; Magupalli et al., 2008) in the YTH system for interaction with GCAP2. In agreement with the essential requirement of NADH in promoting RIBEYE/GCAP2 interaction in fusion protein pull-down analyses, GCAP2 did not bind to the NADH-binding-deficient RIBEYE point mutant RIBEYE(B)G730A in the YTH system as judged by the lack of growth on −ALWH selective medium and lack of β-galactosidase (β-gal) expression (mating 2). Mating 1 indicates a positive control [RIBEYE(B) mated with GCAP2]. Matings 3–6 show the respective autoactivation controls. RIBEYE(B)G730A is still able to homodimerize with wild-type RIBEYE(B), demonstrating that RIBEYE(B)G730A is not misfolded (mating 7). For convenience, experimental bait–prey pairs are underlayered in color (green, interacting bait–prey pairs; yellow, noninteracting bait–prey pairs); control matings are not colored. ALWH, Dropout medium lacking adenine, leucine, tryptophan, and histidine; LW, dropout medium lacking leucine and tryptophan.
Figure 10.
Figure 10.
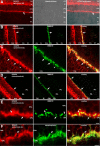
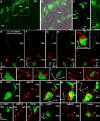
Overexpression of GCAP2 in photoreceptor terminals disassembles synaptic ribbons. A–D, Recombinant expression of either GCAP2-EGFP or EGFP in organotypic retina explant cultures. SLF virus efficiently infects photoreceptors in organotypical explant cultures of the retina. SLF-mediated GCAP2-EGFP (A–C) heterologous expression labels the entire photoreceptor from the inner segments to the synaptic terminals (arrows) in the OPL. As generally observed by us and other groups (Fischer et al., 2000; Perez-Leon et al., 2003; Zhang et al., 2008), outer segments are absent from explant preparations. In analogy to GCAP2-EGFP expression, infection with EGFP-SLF virus also leads to labeling of the entire photoreceptor (D) in retina explant culture. Scale bars: A–D, 10 μm. E–Q, Three-dimensional reconstructions of individual optical stacks along the z-axis of SLF-virus-infected retina explant recorded with the Apotome (Zeiss). To visualize synaptic ribbons in GCAP2-EGFP- and EGFP-infected retina explants, samples were immunolabeled with polyclonal RIBEYE antibody (U2656; red signals). Synaptic ribbons are abundantly present in the OPL of the organotypical retina cultures (E–L, arrowheads) but absent from GCAP2-EGFP-expressing photoreceptor terminals (E–I, white arrows; J–Q, asterisks). E–I show lower magnifications of a three-dimensional reconstructed GCAP2-EGFP expressing photoreceptor from different angles to emphasize the lack of synaptic ribbons within the terminal (white arrows) without influencing the presence of synaptic ribbons (E, F, K, L, arrowheads) in the neighboring noninfected photoreceptors. The x, y, and z labeled arrows indicate the coordinate axes in the three dimensions and are scaled to represent the distance of 5 μm in each spacial direction. J–L, High magnifications of GCAP2-EGFP infected photoreceptor terminals. Although many synaptic ribbons (red signals; E, F, K, arrowheads) can be detected next to the GCAP2 virus-infected terminals (asterisks), no synaptic ribbons are present within the GCAP2-overexpressing terminals. The synaptic terminals are labeled by white arrows in E and F, and by asterisks in K and L. M–Q, Lack of synaptic ribbons within GCAP2-infected photoreceptor terminals is not caused by a cytopathic effect of virus infection as such, because terminals overexpressing EGFP alone do contain synaptic ribbons as visualized by the yellow color within the EGFP-expressing synaptic terminals (N–Q, arrowheads). Arrows in M–Q are synaptic ribbons that are located outside of virus-infected terminals. N, O, Views of the same infected, EGFP-expressing terminal as in M, but from different angles. IS, Inner segments; ONL, outer nuclear layer.
Figure 11.
Figure 11.
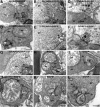
Overexpression of GCAP2 in photoreceptor terminals disassembles synaptic ribbons. Electron microscopic analyses are shown. A–L, Expression of either GCAP2-EGFP (A–G) or EGFP in organotypic retina explant cultures by the respective recombinant viruses (H–L) (see also Fig. 10). Seven representative images of photoreceptor synapses from GCAP2-EGFP-infected retinas are shown in A–G; five representative images of photoreceptor synapses from EGFP-infected retinas are shown in H–L (control infections). Infection with GCAP-EGFP (A–G) leads to a loss of synaptic ribbons at the presynaptic active zones (arrows). In many cases, instead of bar-shaped anchored synaptic ribbons, floating, nonanchored spherical synaptic ribbons (ss) were observed, which are considered as intermediate stages in the disassembly of synaptic ribbons. EGFP-infected photoreceptors (control infections; H–L) displayed normal photoreceptor terminals with normal-looking bar-shaped synaptic ribbons. pr, Presynaptic terminal; po, postsynaptic dendrites; sr, synaptic ribbon; m, mitochondrion. Scale bars: A, B, D, E, 1 μm; C, 250 nm; F, G–L, 500 nm.

Similar articles

Cited by

References

    1. Alpadi K, Magupalli VG, Käppel S, Köblitz L, Seigel GM, Sung CH, Schmitz F. RIBEYE recruits Munc119, a mammalian ortholog of the Caenorhabditis elegans protein unc119, to synaptic ribbons of photoreceptor synapses. J Biol Chem. 2008;283:2641–26467. - PMC - PubMed
    1. Ames JB, Dizhoor AM, Ikura M, Palczewski K, Stryer L. Three-dimensional structure of guanylyl cyclase activating protein-2, a calcium-sensitive modulator of photoreceptor guanylyl cyclases. J Biol Chem. 1999;274:19329–19337. - PubMed
    1. Ashery U, Betz A, Xu T, Brose N, Rettig J. An efficient method for the infection of adrenal chromaffin cells using the Semliki Forest virus gene expression system. Eur J Cell Biol. 1999;78:525–532. - PubMed
    1. Balasubramanian P, Zhao LJ, Chinnadurai G. Nicotinamide adenine dinucleotide stimulates oligomerization, interaction with E1A and an intrinsic dehydrogenase activity of CtBP. FEBS Lett. 2003;537:157–160. - PubMed
    1. Barnes CJ, Vadlamudi RK, Mishra SK, Jacobson RH, Liu F, Kumar R. Functional inactivation of a transcriptional corepressor by a signalling kinase. Nat Struct Biol. 2003;10:622–628. - PubMed

Publication types

MeSH terms

LinkOut - more resources