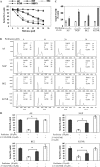
In vitro and in vivo inhibition of neuroblastoma tumor cell growth by AKT inhibitor perifosine
- PMID: 20463309
- PMCID: PMC2879416
- DOI: 10.1093/jnci/djq125
In vitro and in vivo inhibition of neuroblastoma tumor cell growth by AKT inhibitor perifosine
Erratum in
-
Correction to: In Vitro and In Vivo Inhibition of Neuroblastoma Tumor Cell Growth by AKT Inhibitor Perifosine.J Natl Cancer Inst. 2024 Aug 1;116(8):1406. doi: 10.1093/jnci/djae167. J Natl Cancer Inst. 2024. PMID: 38994894 No abstract available.
Abstract
Background: Activated AKT is a marker of decreased event-free or overall survival in neuroblastoma (NB) patients. The aim of this study was to investigate the effect of perifosine, a nontoxic AKT inhibitor, as a single agent on NB cell growth in vitro and in vivo.
Methods: Four human NB cell lines (AS, NGP, BE2, and KCNR) were treated with increasing concentrations of perifosine, and a quantitative analysis of cell death (apoptosis) was performed by using MTS and caspase-3/7 activity assays. Survival of mice carrying xenograft NB tumors that were treated with perifosine (n = 6-7 mice per group) was compared with that of untreated mice (n = 7 mice per group) using Kaplan-Meier analysis. Tumor volumes were calculated to determine the effect of perifosine on NB tumor growth. Phosphorylation of AKT and expression of cleaved caspase-3 were measured in proteins from the tumors. All statistical tests were two-sided.
Results: Perifosine, at 30 muM concentration, decreased AKT phosphorylation and increased apoptosis in all four NB cell lines in vitro. Perifosine-treated mice bearing xenograft NB tumors had longer survival than untreated mice (untreated vs treated, median survival: AS, 13 days, 95% confidence interval [CI] = 11 to 16 days vs not reached, P = .003; NGP, 22 days, 95% CI = 20 to 26 days vs not reached, P = .013; BE2, 24 days, 95% CI = 21 to 27 days vs not reached, P < .001; and KCNR, 18 days, 95% CI = 18 to 21 days vs not reached, P < .001). Perifosine treatment induced regression in AS tumors, growth inhibition in BE2 tumors, and slower growth in NGP and KCNR tumors. Inhibition of AKT phosphorylation and induction of caspase-dependent apoptosis were noted in tumors of perifosine-treated mice in all four in vivo NB tumor models.
Conclusions: Perifosine inhibited the activation of AKT and was an effective cytotoxic agent in NB cells in vitro and in vivo. Our study supports the future clinical evaluation of perifosine for the treatment of NB tumors.
Figures


Comment in
-
Getting into the AKT.J Natl Cancer Inst. 2010 Jun 2;102(11):747-9. doi: 10.1093/jnci/djq171. Epub 2010 May 12. J Natl Cancer Inst. 2010. PMID: 20463308 No abstract available.
Similar articles
-
Perifosine-induced inhibition of Akt attenuates brain-derived neurotrophic factor/TrkB-induced chemoresistance in neuroblastoma in vivo.Cancer. 2011 Dec 1;117(23):5412-22. doi: 10.1002/cncr.26133. Epub 2011 May 16. Cancer. 2011. PMID: 21590687 Free PMC article.
-
Getting into the AKT.J Natl Cancer Inst. 2010 Jun 2;102(11):747-9. doi: 10.1093/jnci/djq171. Epub 2010 May 12. J Natl Cancer Inst. 2010. PMID: 20463308 No abstract available.
-
The alkylphospholipid perifosine induces apoptosis of human lung cancer cells requiring inhibition of Akt and activation of the extrinsic apoptotic pathway.Mol Cancer Ther. 2007 Jul;6(7):2029-38. doi: 10.1158/1535-7163.MCT-07-0004. Epub 2007 Jun 29. Mol Cancer Ther. 2007. PMID: 17604333
-
Perifosine: update on a novel Akt inhibitor.Curr Oncol Rep. 2009 Mar;11(2):102-10. doi: 10.1007/s11912-009-0016-4. Curr Oncol Rep. 2009. PMID: 19216841 Free PMC article. Review.
-
Current view on the mechanism of action of perifosine in cancer.Anticancer Agents Med Chem. 2014 May;14(4):629-35. doi: 10.2174/1871520614666140309225912. Anticancer Agents Med Chem. 2014. PMID: 24628236 Review.
Cited by
-
Effects of ionizing radiation in combination with Erufosine on T98G glioblastoma xenograft tumours: a study in NMRI nu/nu mice.Radiat Oncol. 2012 Oct 18;7:172. doi: 10.1186/1748-717X-7-172. Radiat Oncol. 2012. PMID: 23078969 Free PMC article.
-
Dissecting the PI3K Signaling Axis in Pediatric Solid Tumors: Novel Targets for Clinical Integration.Front Oncol. 2013 Apr 23;3:93. doi: 10.3389/fonc.2013.00093. eCollection 2013. Front Oncol. 2013. PMID: 23638435 Free PMC article.
-
Proteome and Acetylome Analysis Identifies Novel Pathways and Targets Regulated by Perifosine in Neuroblastoma.Sci Rep. 2017 Feb 6;7:42062. doi: 10.1038/srep42062. Sci Rep. 2017. PMID: 28165023 Free PMC article.
-
PI3K and Akt as molecular targets for cancer therapy: current clinical outcomes.Acta Pharmacol Sin. 2012 Dec;33(12):1441-58. doi: 10.1038/aps.2012.72. Epub 2012 Sep 17. Acta Pharmacol Sin. 2012. PMID: 22983389 Free PMC article. Review.
-
Dual Roles of Autophagy and Their Potential Drugs for Improving Cancer Therapeutics.Biomol Ther (Seoul). 2020 Nov 1;28(6):503-511. doi: 10.4062/biomolther.2020.155. Biomol Ther (Seoul). 2020. PMID: 33077698 Free PMC article. Review.
References
-
- Brodeur GM, Pritchard J, Berthold F, et al. Revisions of the international criteria for neuroblastoma diagnosis, staging, and response to treatment. J Clin Oncol. 1993;11(8):1466–1477. - PubMed
-
- Stiller CA, Parkin DM. International variations in the incidence of neuroblastoma. Int J Cancer. 1992;52(4):538–543. - PubMed
-
- Brodeur GM, Maris JM. Neuroblastoma. In: Pizzo PA, Poplack DG, editors. Principles and Practice of Pediatric Oncology. 5th ed. Philadelphia, PA: J B Lippincott Company; 2006. pp. 933–970.
-
- Maris JM, Hogarty MD, Bagatell R, Cohn SL. Neuroblastoma. Lancet. 2007;369(9579):2106–2120. - PubMed
-
- Mueller S, Matthay KK. Neuroblastoma: biology and staging. Curr Oncol Rep. 2009;11(6):431–438. - PubMed
Publication types
MeSH terms
Substances
Grants and funding
LinkOut - more resources
Full Text Sources
Other Literature Sources
Medical
Research Materials

