

Validation of a method for measuring the volumetric breast density from digital mammograms
- PMID: 20463377
- PMCID: PMC3052857
- DOI: 10.1088/0031-9155/55/11/003
Validation of a method for measuring the volumetric breast density from digital mammograms
Abstract
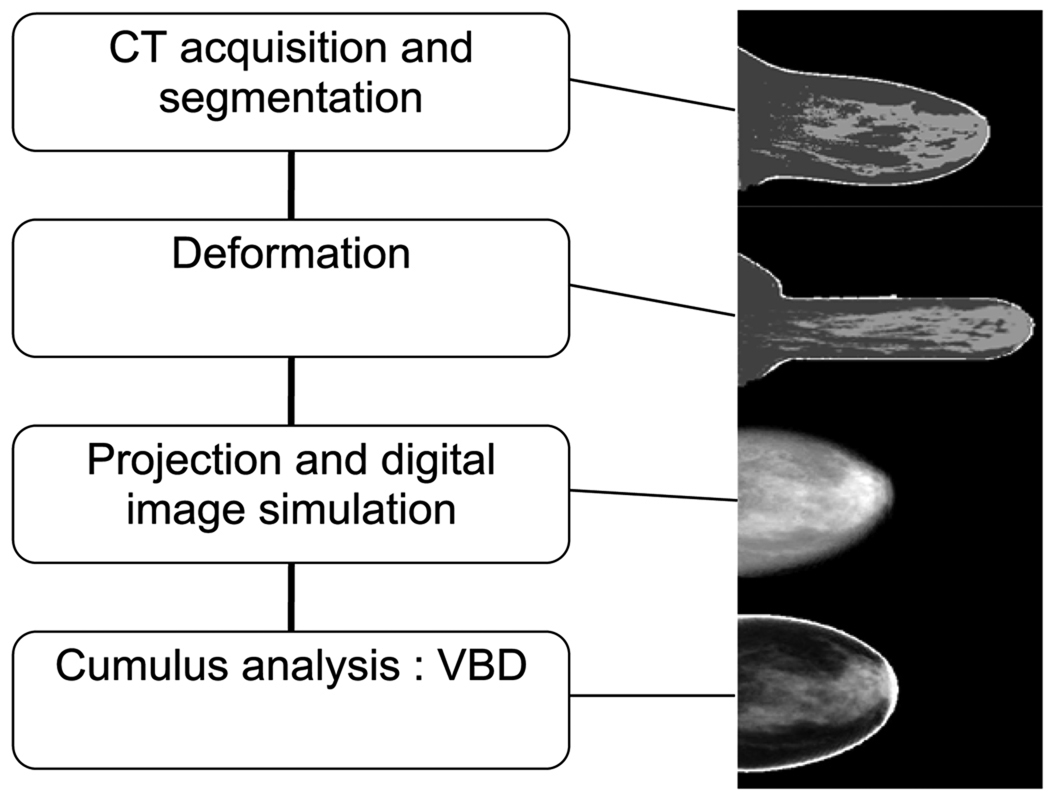
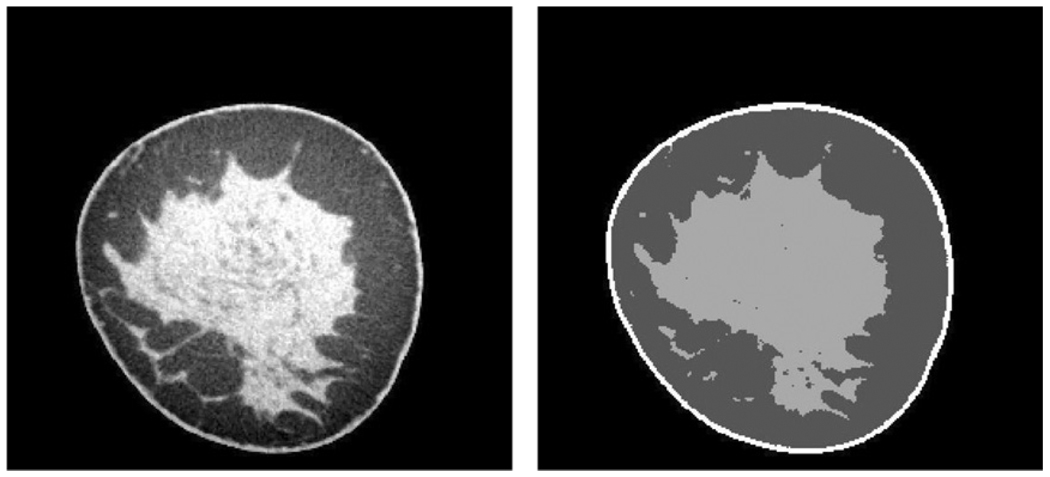
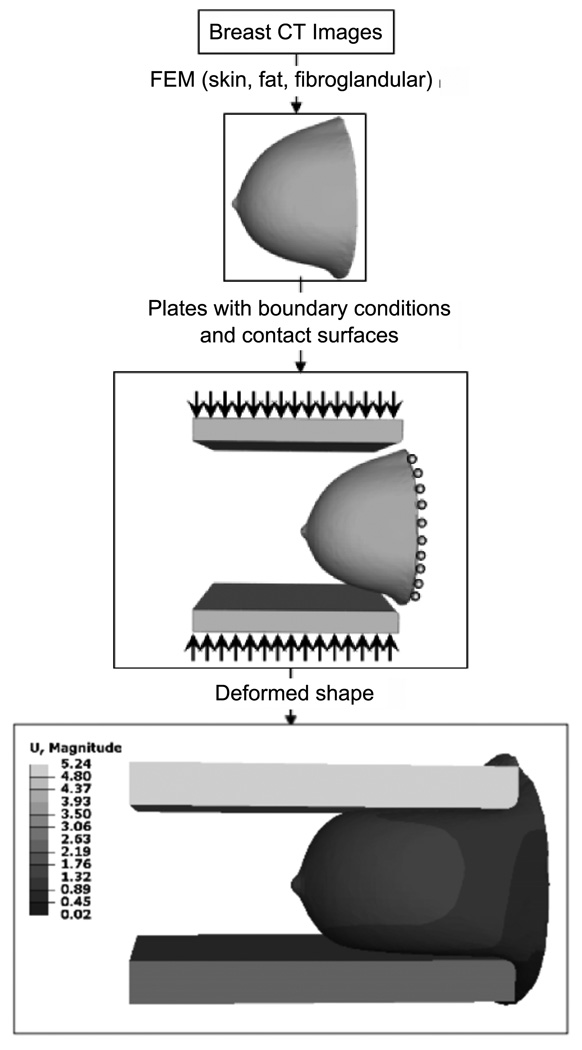
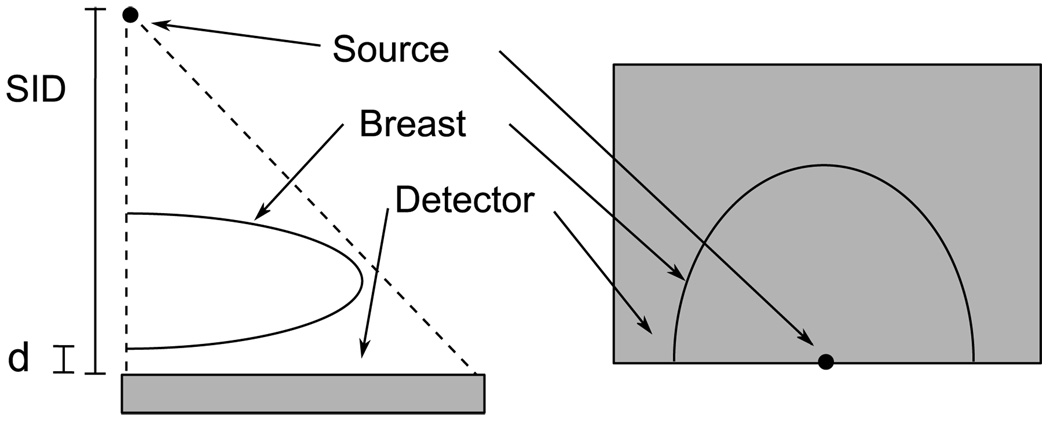
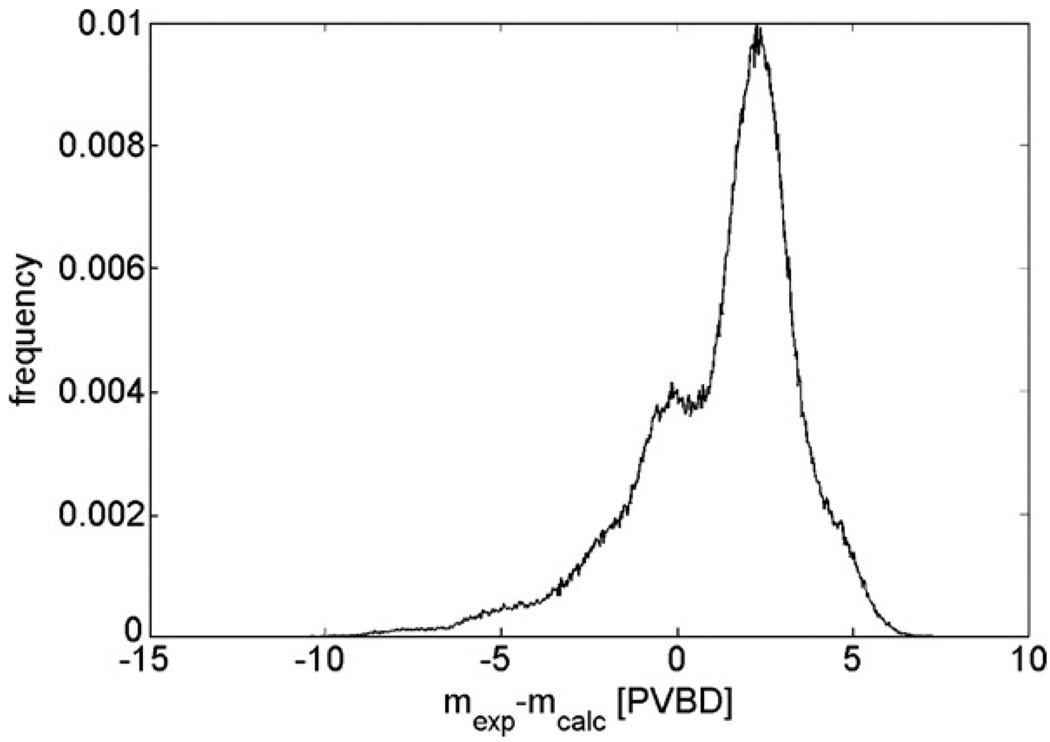
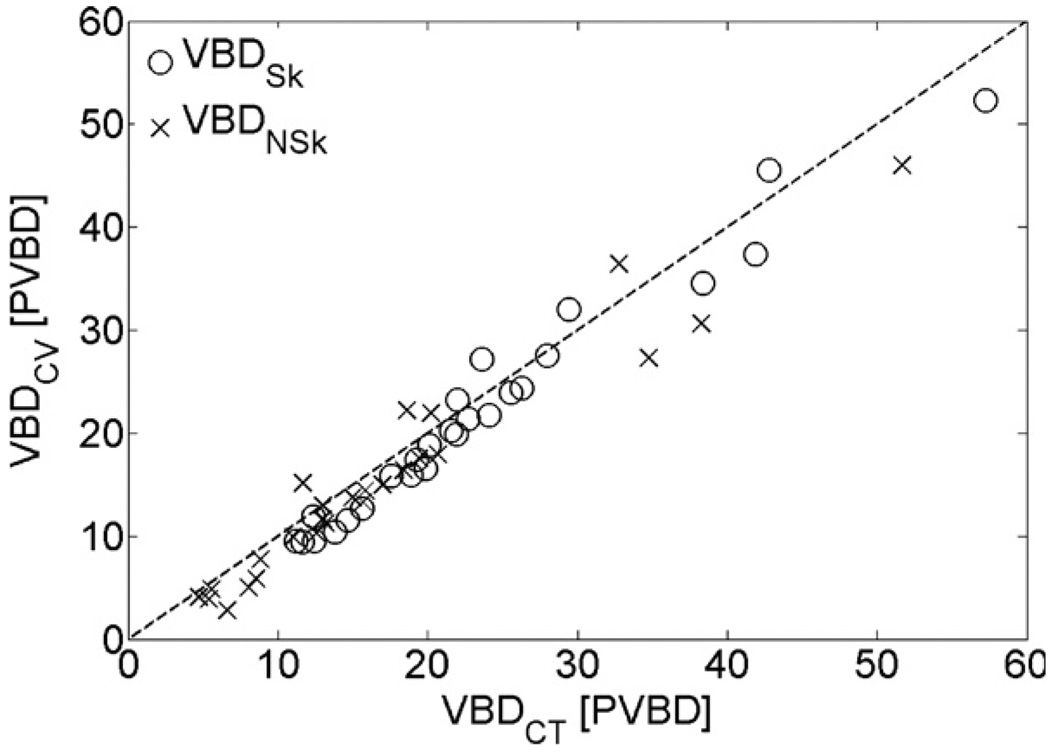
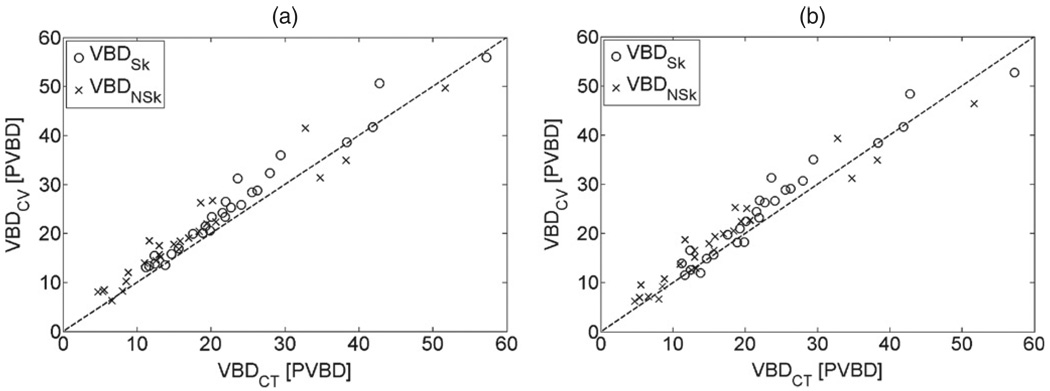
The purpose of this study was to evaluate the performance of an algorithm used to measure the volumetric breast density (VBD) from digital mammograms. The algorithm is based on the calibration of the detector signal versus the thickness and composition of breast-equivalent phantoms. The baseline error in the density from the algorithm was found to be 1.25 +/- 2.3% VBD units (PVBD) when tested against a set of calibration phantoms, of thicknesses 3-8 cm, with compositions equivalent to fibroglandular content (breast density) between 0% and 100% and under x-ray beams between 26 kVp and 32 kVp with a Rh/Rh anode/filter. The algorithm was also tested against images from a dedicated breast computed tomography (CT) scanner acquired on 26 volunteers. The CT images were segmented into regions representing adipose, fibroglandular and skin tissues, and then deformed using a finite-element algorithm to simulate the effects of compression in mammography. The mean volume, VBD and thickness of the compressed breast for these deformed images were respectively 558 cm(3), 23.6% and 62 mm. The displaced CT images were then used to generate simulated digital mammograms, considering the effects of the polychromatic x-ray spectrum, the primary and scattered energy transmitted through the breast, the anti-scatter grid and the detector efficiency. The simulated mammograms were analyzed with the VBD algorithm and compared with the deformed CT volumes. With the Rh/Rh anode filter, the root mean square difference between the VBD from CT and from the algorithm was 2.6 PVBD, and a linear regression between the two gave a slope of 0.992 with an intercept of -1.4 PVBD and a correlation with R(2) = 0.963. The results with the Mo/Mo and Mo/Rh anode/filter were similar.
Figures
References
-
- Boone JM, Alexander LC, Kwan J, Seibert A, Shah N, Karen KL, Nelson TR. Technique factors and their relationship to radiation dose in pendant geometry breast CT. Med. Phys. 2005;32:3767–3776. - PubMed
-
- Boone JM, Cooper VN., III Scatter/primary in mammography: Monte Carlo validation. Med. Phys. 2000;27:1818–1831. - PubMed
-
- Boone JM, Fewell TR, Jennings RJ. Molybdenum, rhodium, and tungsten anode spectral models using interpolating polynomials with application to mammography. Med. Phys. 1997;24:1863–1874. - PubMed
-
- Boone JM, Kwan AL, Yang K, Burkett GW, Lindfors KK, Nelson TR. Computed tomography for imaging the breast. J. Mammary Gland Biol. Neoplasia. 2006a;11:103–111. - PubMed
-
- Boone JM, Lindfors KK, Cooper VN, III, Seibert JA. Scatter/primary in mammography: comprehensive results. Med. Phys. 2000;27:2408–2416. - PubMed
Publication types
MeSH terms
Grants and funding
LinkOut - more resources
Full Text Sources
Other Literature Sources
Medical