Immune exhaustion occurs concomitantly with immune activation and decrease in regulatory T cells in viremic chronically HIV-1-infected patients
- PMID: 20463584
- PMCID: PMC3095513
- DOI: 10.1097/QAI.0b013e3181e0c7d0
Immune exhaustion occurs concomitantly with immune activation and decrease in regulatory T cells in viremic chronically HIV-1-infected patients
Abstract
Background: Chronic HIV-1 infection is associated with excessive immune activation and immune exhaustion. We investigated the relationship of these 2 phenotypes and frequency of regulatory T cells (Tregs) in controlled and uncontrolled chronic HIV-1 infection.
Methods: Immune exhaustion marker PD-1, its ligand PD-L1, CD4CD25 FoxP3 Tregs, HLA-DR, and CD38 coexpression as activation markers were investigated in peripheral blood lymphocytes of 44 HIV-1-infected patients and 11 HIV-1-uninfected controls by multicolor flow cytometry.
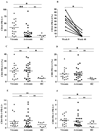
Results: Activated and PD-1 expressing T cells were increased, and Tregs were decreased in HIV-1-infected patients as compared with controls, and alterations were greatest in viremic patients. The proportion of activated CD8 T cells exceeded activated CD4 T cells. Tregs had an inverse correlation with activated T cells and PD-1 expressing T cells. PD-L1 was highly expressed on monocytes and to a lesser extent on T lymphocytes of patients. These abnormalities partially reversed with virologic control after potent antiretroviral therapy.
Conclusions: Immune exhaustion is a component of aberrant immune activation in chronic HIV-1 infection and is associated with loss of Tregs and ongoing virus replication. These defects are corrected partially with effective virologic control by potent antiretroviral therapy.
Figures


Similar articles
-
PD-1 Upregulation Is Associated with Exhaustion of Regulatory T Cells and Reflects Immune Activation in HIV-1-Infected Individuals.AIDS Res Hum Retroviruses. 2019 May;35(5):444-452. doi: 10.1089/AID.2018.0218. Epub 2019 Feb 28. AIDS Res Hum Retroviruses. 2019. PMID: 30618263
-
Severe immune dysregulation affects CD4⁺CD25(hi)FoxP3⁺ regulatory T cells in HIV-infected patients with low-level CD4 T-cell repopulation despite suppressive highly active antiretroviral therapy.J Infect Dis. 2012 May 15;205(10):1501-9. doi: 10.1093/infdis/jis230. Epub 2012 Mar 28. J Infect Dis. 2012. PMID: 22457273
-
FOXP3+Helios+ Regulatory T Cells, Immune Activation, and Advancing Disease in HIV-Infected Children.J Acquir Immune Defic Syndr. 2016 Aug 15;72(5):474-84. doi: 10.1097/QAI.0000000000001000. J Acquir Immune Defic Syndr. 2016. PMID: 27003495 Free PMC article.
-
The split personality of regulatory T cells in HIV infection.Blood. 2013 Jan 3;121(1):29-37. doi: 10.1182/blood-2012-07-409755. Epub 2012 Oct 4. Blood. 2013. PMID: 23043072 Review.
-
Comprehensive Mass Cytometry Analysis of Cell Cycle, Activation, and Coinhibitory Receptors Expression in CD4 T Cells from Healthy and HIV-Infected Individuals.Cytometry B Clin Cytom. 2017 Jan;92(1):21-32. doi: 10.1002/cyto.b.21502. Cytometry B Clin Cytom. 2017. PMID: 27997758 Review.
Cited by
-
High expression of CD38 and MHC class II on CD8+ T cells during severe influenza disease reflects bystander activation and trogocytosis.Clin Transl Immunology. 2021 Sep 8;10(9):e1336. doi: 10.1002/cti2.1336. eCollection 2021. Clin Transl Immunology. 2021. PMID: 34522380 Free PMC article.
-
Safety and Immune Responses Following Anti-PD-1 Monoclonal Antibody Infusions in Healthy Persons With Human Immunodeficiency Virus on Antiretroviral Therapy.Open Forum Infect Dis. 2024 Jan 11;11(3):ofad694. doi: 10.1093/ofid/ofad694. eCollection 2024 Mar. Open Forum Infect Dis. 2024. PMID: 38449916 Free PMC article. Clinical Trial.
-
Soluble CD163 made by monocyte/macrophages is a novel marker of HIV activity in early and chronic infection prior to and after anti-retroviral therapy.J Infect Dis. 2011 Jul 1;204(1):154-63. doi: 10.1093/infdis/jir214. J Infect Dis. 2011. PMID: 21628670 Free PMC article.
-
Acting locally: innate mucosal immunity in resistance to HIV-1 infection in Kenyan commercial sex workers.Mucosal Immunol. 2014 Mar;7(2):268-79. doi: 10.1038/mi.2013.44. Epub 2013 Jun 26. Mucosal Immunol. 2014. PMID: 23801306
-
Blockade of the PD-1 axis alone is not sufficient to activate HIV-1 virion production from CD4+ T cells of individuals on suppressive ART.PLoS One. 2019 Jan 25;14(1):e0211112. doi: 10.1371/journal.pone.0211112. eCollection 2019. PLoS One. 2019. PMID: 30682108 Free PMC article.
References
-
- Rothenstein D, Sayegh MH. T-cell costimulatory pathways in allograft rejection and tolerance. Immunol Rev. 2003;196:185–108. - PubMed
-
- Appay V, Sauce D. Immune activation and inflammation in HIV-1 infection: causes and consequences. J Pathol. 2008;214:231–241. - PubMed
-
- Phillips AN, Sabin CA, Elford J, et al. CD8 lymphocyte counts and serum immunoglobulin A levels early in HIV infection as predictors of CD4 lymphocyte depletion during 8 years of follow-up. Aids. 1993;7:975–980. - PubMed
-
- Wen T, Bukczynski J, Watts TH. 4-1BB ligand-mediated costimulation of human T cells induces CD4 and CD8 T cell expansion, cytokine production, and the development of cytolytic effector function. J Immunol. 2002;168:4897–4906. - PubMed
Publication types
MeSH terms
Substances
Grants and funding
LinkOut - more resources
Full Text Sources
Other Literature Sources
Medical
Research Materials

