. 2010 May 13;465(7295):188-93.
doi: 10.1038/nature09057.

Single-molecule dynamics of gating in a neurotransmitter transporter homologue

Affiliations

Single-molecule dynamics of gating in a neurotransmitter transporter homologue

Yongfang Zhao et al. Nature. .

Abstract

Neurotransmitter:Na(+) symporters (NSS) remove neurotransmitters from the synapse in a reuptake process that is driven by the Na(+) gradient. Drugs that interfere with this reuptake mechanism, such as cocaine and antidepressants, profoundly influence behaviour and mood. To probe the nature of the conformational changes that are associated with substrate binding and transport, we have developed a single-molecule fluorescence imaging assay and combined it with functional and computational studies of the prokaryotic NSS homologue LeuT. Here we show molecular details of the modulation of intracellular gating of LeuT by substrates and inhibitors, as well as by mutations that alter binding, transport or both. Our direct observations of single-molecule transitions, reflecting structural dynamics of the intracellular region of the transporter that might be masked by ensemble averaging or suppressed under crystallographic conditions, are interpreted in the context of an allosteric mechanism that couples ion and substrate binding to transport.


Figures

Figure 1
Figure 1. Structural landmarks and the disposition of the engineered Cys pairs in the crystal structure of LeuT
(a) Side view of the LeuT crystal structure equilibrated in a POPC lipid bilayer, showing Leu in S1, CMI in S2, sodium ions identified as yellow spheres, and the surrounding lipid molecules shown in thin stick rendering. The intracellular surface is at the bottom of the figure. Residues involved in conserved ionic:cation-π interactions in both the putative extracellular and intracellular gates are shown in volume rendering. Panels (b) and (c) indicate the Cys pairs used in this study to monitor rearrangements at the extracellular (b) and intracellular (c) ends of the transporter, under designated conditions.
Figure 2
Figure 2. Single-molecule imaging of LeuT
(a) His-tagged, dye-labeled LeuT- H7C/R86C was immobilized by biotin-NTA-Ni2+ to the streptavidin-treated surface. (b) Representative fluorescence (Cy3 donor in green, Cy5 acceptor in red) and FRET (blue) time traces from experiments in 200 mM KCl. (c) FRET traces were summed into histograms in 200 mM KCl (left), 200 mM NaCl (center), and 200 mM NaCl with 20 µM leucine (right). Each two-dimensional histogram was summed over time (gray bars, on side), filtered to remove fluorophore dark states (see Supplementary Methods), and fit to the sum (red) of two Gaussian distributions (blue) to estimate the mean value and relative occupancies of each FRET state. (d) Histograms are shown for experiments performed in 5 mM NaCl with: no substrate (left), 200 nM Leu (center), and 20 µM Leu (right). Scale shown at right indicates the relative population.
Figure 3
Figure 3. The structural context of the observed dynamic changes
(a) Evolution of Cβ-Cβ distances for specific residues observed in MD simulations in the absence (dotted lines) and presence (solid lines) of simulated transport. (b) Superposition of the snapshots from the MD equilibrations of the crystal structure of LeuT (gray) and the inward-open structure (orange) indicating the conformational rearrangements predicted from the MD simulations in the transport mechanism (see Supplemental Movie). In this MD frame, the descending Leu substrate is shown near the site of intracellular opening, where the proposed TM1a rearrangement is indicated by arrows. The left and right panels show views parallel to the membrane and from the intracellular side, respectively. The dotted lines comprising the intracellular ends of the same TMs that surround the exiting substrate in the open-inward structure obtained through simulation (orange) yield larger circumference than in the crystal structure (gray).
Figure 4
Figure 4. Effects of mutation and CMI on FRET histograms of LeuT-H7C/R86C and LeuT-239C/480C
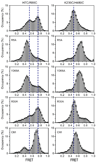
FRET histograms from single-molecule traces obtained in the presence of 200 mM KCl for LeuT-H7C/R86C (left) and LeuT-239C/H480C (right) are shown in the context of the mutations R5A, Y268A, R30A or the presence of 0.5 mM CMI. For clarity, fluorophore dark states have been computationally removed from all histograms (Supplementary Methods).
Figure 5
Figure 5. Long single-molecule trajectories reveal FRET transitions
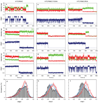
Representative single-molecule traces from 160 ms images are shown for LeuT-H7C/R86C (left), LeuT-H7C/R86C/Y268A (center), and LeuT-H7C/R86C/R5A (right) in 200 mM KCl (a, e, i), 200 mM NaCl (b, f, j) or 200 mM NaCl and 20 µM Leu (c, g, k). Cy3 (donor) and cy5 (acceptor) fluorescence are shown in green and red respectively. FRET efficiency is shown in blue. One-dimensional histograms (d, h, l) represent the population data obtained in the presence of 200 mM KCl (gray bars), 200 mM NaCl (blue line), or 200 mM NaCl and 20 µM Leu (red line).

Comment in

References

    1. Amara SG, Sonders MS. Neurotransmitter transporters as molecular targets for addictive drugs. Drug Alcohol Depend. 1998;51(1–2):87–96. - PubMed
    1. Rudnick G. Mechanisms of biogenic amine neurotransmitter transporters. 2nd ed. Totowa, New Jersey: Humana Press Inc; 2002.
    1. Sonders MS, Quick M, Javitch JA. How did the neurotransmitter cross the bilayer? A closer view. Curr Opin Neurobiol. 2005;15(3):296–304. - PubMed
    1. Gu H, Wall SC, Rudnick G. Stable expression of biogenic amine transporters reveals differences in inhibitor sensitivity, kinetics, and ion dependence. J Biol Chem. 1994;269(10):7124–7130. - PubMed
    1. Torres GE, Gainetdinov RR, Caron MG. Plasma membrane monoamine transporters: structure, regulation and function. Nat Rev Neurosci. 2003;4(1):13–25. - PubMed

Methods References

    1. Quick M, Javitch JA. Monitoring the function of membrane transport proteins in detergent-solubilized form. Proc Natl Acad Sci U S A. 2007;104(9):3603–3608. - PMC - PubMed
    1. Schaffner W, Weissmann C. A rapid, sensitive, and specific method for the determination of protein in dilute solution. Anal Biochem. 1973;56(2):502–514. - PubMed
    1. Lakowicz JR. Principles of Fluorescence Spectroscopy. 3rd ed. Baltimore, MD: Springer; 2006.
    1. Mujumdar RB, et al. Cyanine dye labeling reagents: sulfoindocyanine succinimidyl esters. Bioconjug Chem. 1993;4(2):105–111. - PubMed
    1. Williams A, Winfield AS, Miller NJ. Relative fluorescence quantum yields using a computer-controlled luminescence spectrometer. Analyst. 1983;108:1067–1071.

Publication types

MeSH terms