Elevation of intact and proteolytic fragments of acute phase proteins constitutes the earliest systemic antiviral response in HIV-1 infection
- PMID: 20463814
- PMCID: PMC2865525
- DOI: 10.1371/journal.ppat.1000893
Elevation of intact and proteolytic fragments of acute phase proteins constitutes the earliest systemic antiviral response in HIV-1 infection
Abstract
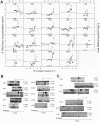
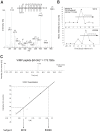
The earliest immune responses activated in acute human immunodeficiency virus type 1 infection (AHI) exert a critical influence on subsequent virus spread or containment. During this time frame, components of the innate immune system such as macrophages and DCs, NK cells, beta-defensins, complement and other anti-microbial factors, which have all been implicated in modulating HIV infection, may play particularly important roles. A proteomics-based screen was performed on a cohort from whom samples were available at time points prior to the earliest positive HIV detection. The ability of selected factors found to be elevated in the plasma during AHI to inhibit HIV-1 replication was analyzed using in vitro PBMC and DC infection models. Analysis of unique plasma donor panels spanning the eclipse and viral expansion phases revealed very early alterations in plasma proteins in AHI. Induction of acute phase protein serum amyloid A (A-SAA) occurred as early as 5-7 days prior to the first detection of plasma viral RNA, considerably prior to any elevation in systemic cytokine levels. Furthermore, a proteolytic fragment of alpha-1-antitrypsin (AAT), termed virus inhibitory peptide (VIRIP), was observed in plasma coincident with viremia. Both A-SAA and VIRIP have anti-viral activity in vitro and quantitation of their plasma levels indicated that circulating concentrations are likely to be within the range of their inhibitory activity. Our results provide evidence for a first wave of host anti-viral defense occurring in the eclipse phase of AHI prior to systemic activation of other immune responses. Insights gained into the mechanism of action of acute-phase reactants and other innate molecules against HIV and how they are induced could be exploited for the future development of more efficient prophylactic vaccine strategies.
Conflict of interest statement
The authors have declared that no competing interests exist.
Figures


Similar articles
-
Induction of a striking systemic cytokine cascade prior to peak viremia in acute human immunodeficiency virus type 1 infection, in contrast to more modest and delayed responses in acute hepatitis B and C virus infections.J Virol. 2009 Apr;83(8):3719-33. doi: 10.1128/JVI.01844-08. Epub 2009 Jan 28. J Virol. 2009. PMID: 19176632 Free PMC article.
-
Initial B-cell responses to transmitted human immunodeficiency virus type 1: virion-binding immunoglobulin M (IgM) and IgG antibodies followed by plasma anti-gp41 antibodies with ineffective control of initial viremia.J Virol. 2008 Dec;82(24):12449-63. doi: 10.1128/JVI.01708-08. Epub 2008 Oct 8. J Virol. 2008. PMID: 18842730 Free PMC article.
-
Magnitude and Quality of Cytokine and Chemokine Storm during Acute Infection Distinguish Nonprogressive and Progressive Simian Immunodeficiency Virus Infections of Nonhuman Primates.J Virol. 2016 Oct 28;90(22):10339-10350. doi: 10.1128/JVI.01061-16. Print 2016 Nov 15. J Virol. 2016. PMID: 27630228 Free PMC article.
-
Innate immunity in acute HIV-1 infection.Curr Opin HIV AIDS. 2011 Sep;6(5):353-63. doi: 10.1097/COH.0b013e3283495996. Curr Opin HIV AIDS. 2011. PMID: 21734567 Free PMC article. Review.
-
Innate gamma/delta T-cells during HIV infection: Terra relatively Incognita in novel vaccination strategies?AIDS Rev. 2011 Jan-Mar;13(1):3-12. AIDS Rev. 2011. PMID: 21412385 Review.
Cited by
-
Alpha-1-antitrypsin interacts with gp41 to block HIV-1 entry into CD4+ T lymphocytes.BMC Microbiol. 2016 Jul 29;16(1):172. doi: 10.1186/s12866-016-0751-2. BMC Microbiol. 2016. PMID: 27473095 Free PMC article.
-
The role of humoral innate immunity in hepatitis C virus infection.Viruses. 2012 Jan;4(1):1-27. doi: 10.3390/v4010001. Epub 2012 Jan 5. Viruses. 2012. PMID: 22355450 Free PMC article. Review.
-
Subclinical effects of remote ischaemic conditioning in human kidney transplants revealed by quantitative proteomics.Clin Proteomics. 2020 Nov 2;17(1):39. doi: 10.1186/s12014-020-09301-x. Clin Proteomics. 2020. PMID: 33292164 Free PMC article.
-
High-density lipoprotein-mediated cholesterol efflux capacity is improved by treatment with antiretroviral therapy in acute human immunodeficiency virus infection.Open Forum Infect Dis. 2014 Dec 16;1(3):ofu108. doi: 10.1093/ofid/ofu108. eCollection 2014 Dec. Open Forum Infect Dis. 2014. PMID: 25734176 Free PMC article.
-
Cataloguing of Potential HIV Susceptibility Factors during the Menstrual Cycle of Pig-Tailed Macaques by Using a Systems Biology Approach.J Virol. 2015 Sep;89(18):9167-77. doi: 10.1128/JVI.00263-15. Epub 2015 Jun 24. J Virol. 2015. PMID: 26109722 Free PMC article.
References
-
- Li Q, Duan L, Estes JD, Ma ZM, Rourke T, et al. Peak SIV replication in resting memory CD4+ T cells depletes gut lamina propria CD4+ T cells. Nature. 2005;434:1148–1152. - PubMed
-
- Mattapallil JJ, Douek DC, Hill B, Nishimura Y, Martin M, et al. Massive infection and loss of memory CD4+ T cells in multiple tissues during acute SIV infection. Nature. 2005;434:1093–1097. - PubMed
-
- Deeks SG, Walker BD. Human immunodeficiency virus controllers: mechanisms of durable virus control in the absence of antiretroviral therapy. Immunity. 2007;27:406–416. - PubMed
Publication types
MeSH terms
Substances
Grants and funding
LinkOut - more resources
Full Text Sources
Other Literature Sources
Medical
Research Materials
Miscellaneous

