. 2010 May 6;6(5):e1000896.
doi: 10.1371/journal.ppat.1000896.

Infidelity of SARS-CoV Nsp14-exonuclease mutant virus replication is revealed by complete genome sequencing

Affiliations

Infidelity of SARS-CoV Nsp14-exonuclease mutant virus replication is revealed by complete genome sequencing

Lance D Eckerle et al. PLoS Pathog. .

Abstract

Most RNA viruses lack the mechanisms to recognize and correct mutations that arise during genome replication, resulting in quasispecies diversity that is required for pathogenesis and adaptation. However, it is not known how viruses encoding large viral RNA genomes such as the Coronaviridae (26 to 32 kb) balance the requirements for genome stability and quasispecies diversity. Further, the limits of replication infidelity during replication of large RNA genomes and how decreased fidelity impacts virus fitness over time are not known. Our previous work demonstrated that genetic inactivation of the coronavirus exoribonuclease (ExoN) in nonstructural protein 14 (nsp14) of murine hepatitis virus results in a 15-fold decrease in replication fidelity. However, it is not known whether nsp14-ExoN is required for replication fidelity of all coronaviruses, nor the impact of decreased fidelity on genome diversity and fitness during replication and passage. We report here the engineering and recovery of nsp14-ExoN mutant viruses of severe acute respiratory syndrome coronavirus (SARS-CoV) that have stable growth defects and demonstrate a 21-fold increase in mutation frequency during replication in culture. Analysis of complete genome sequences from SARS-ExoN mutant viral clones revealed unique mutation sets in every genome examined from the same round of replication and a total of 100 unique mutations across the genome. Using novel bioinformatic tools and deep sequencing across the full-length genome following 10 population passages in vitro, we demonstrate retention of ExoN mutations and continued increased diversity and mutational load compared to wild-type SARS-CoV. The results define a novel genetic and bioinformatics model for introduction and identification of multi-allelic mutations in replication competent viruses that will be powerful tools for testing the effects of decreased fidelity and increased quasispecies diversity on viral replication, pathogenesis, and evolution.


Conflict of interest statement

The authors have declared that no competing interests exist.

Figures

Figure 1
Figure 1. SARS-CoV genome organization and nsp14 exoribonuclease motifs.
(A) SARS-CoV genome organization and ORF 1a/b polyprotein expression. The genome is a 29.7-kb positive-sense RNA molecule that is capped (dark circle) and polyadenylated. Genes are indicated for the replicase (ORF 1a and ORF 1b; white), structural proteins [Spike (S), Envelope (E), membrane (M), and nucleocapsid (N) proteins; black], and accessory proteins (light gray). ORF 1b is accessed by ribosomal frameshift in the nsp12 coding sequence. The ORF 1a/b polyprotein is translated directly from input genome RNA and processed into 16 mature nsps by two virus-encoded proteinases (gray). Nsps have predicted or demonstrated activities as described in the text. Hel, helicase; Endo; endoribonuclease; MT, 2′-O-methyltransferase. (B) Organization of nsp14 and partial sequence alignment of representative CoV nsp14 sequences with Eschericia coli DNA polymerase III epsilon subunit (DP3E), the proofreading exonuclease subunit of the replicative DNA polymerase (SwissProt P03007). Sequence alignment and GenBank accession numbers for the full-length CoV genomes are as in . Active-site residues of conserved motifs I to III of the DEDD superfamily are indicated in red and by amino acid position in nsp14. A predicted zinc finger domain (Zn F) is located between motifs I and III in the viral sequences, and the predicted zinc-coordinating residues are shown in blue type. Residues replaced with alanine are indicated by black arrows for SARS-CoV mutants S-ExoN1 and S-ExoN3.
Figure 2
Figure 2. Virus isolation and passage strategy.
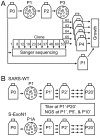
(A) The strategy used for plaque isolation and passage to obtain stocks used in dideoxy (Sanger) DNA sequencing and viral growth analyses. Flasks indicate population stocks, and circles indicate plaque isolation. A single Passage 1 (P1) plaque clone was the parent of all P3 clones used in complete genome sequence analysis (10 clones) or growth analysis (five clones). Clone numbers are shown. S-ExoN1 P3 clone 53 (c53) was used in both sequence and growth analyses. The scheme shown is for S-ExoN1 but an identical scheme was used for SARS-WT except that clone numbers were different and P3 c21 was used in both sequence and growth analyses. For sequencing, P3 plaque homogenates were expanded on fresh cells and total intracellular RNA was obtained (not shown). Genome sequences were defined as P3, whereas P4 viral stocks were used in growth analyses. (B) Serial population passage. Passage numbers in the serial population passage series are designated with a prime. Three clones of SARS-WT or S-ExoN1 were isolated at P1 or P1A, respectively, and passaged in parallel in the P1'-P20' series. Note that P1A in panel B and P1 in panel A are distinct plaque isolation experiments from the same P0 stock. Viral titers were determined at every passage in the P1'-P20' series and next-generation sequencing (NGS) was performed at P1', P5', and P10' for one clonal lineage each for SARS-WT and S-ExoN1.
Figure 3
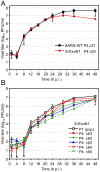
Figure 3. Growth analysis of viral replication.
Growth comparisons of SARS-WT and S-ExoN1 viruses (A), and of multiple S-ExoN1 clones and S-ExoN1 population virus (B). (A) Vero cells were infected with SARS-WT P4 c21 and S-ExoN1 P4 c53 viruses at an MOI of 0.1 PFU/cell. (B) Vero cells were infected with P1 population stock of S-ExoN1 or S-ExoN1 P4 clones (c53, c62, c63, c64, and c65) at an MOI of 0.01 PFU/cell. Samples of culture medium were obtained at 1, 4, 8, 12, 16, 20, 24, 30, 36, and 48 h p.i., and viral titers were determined by plaque assay. Mean titers and standard deviations from triplicate infection series are indicated for each time point.
Figure 4
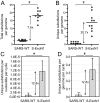
Figure 4. Mutation counts and rates in viral clones.
Complete genome sequences were determined for 10 SARS-WT and 10 S-ExoN1 P3 viral clones. Numbers of total (A) or unique (B) non-engineered nucleotide substitutions identified in SARS-WT and S-ExoN1 genomes are indicated. Each circle represents the mutation count value from a single genome sequence and lines indicate mean mutation counts. Rates of accumulation of unique substitutions per replication cycle on a per nucleotide (C) or per genome (D) basis. Mean values are plotted and error bars indicate standard deviations. *, P<0.0005; Wilcoxon rank-sum test.
Figure 5
Figure 5. Distribution of mutations across genomes of aggregate viral clones.
Combined mutations from 10 SARS-WT and 10 S-ExoN1 P3 viral clones are plotted according to position in the SARS-CoV genome (drawn to scale). Non-engineered mutations are depicted as lollipops and engineered ExoN1 mutations in nsp14 are depicted as a bent vertical line. Red, mutations common to all SARS-WT or all S-ExoN1 clones; green, mutations common to multiple but not all S-ExoN1 clones; blue, mutations unique to one SARS-WT or S-ExoN1 clone. Filled lollipops, nonsynonymous mutations; open lollipops, synonymous mutations; black open lollipops, mutations in non-coding regions. A 30-nt deletion in SARS-WT clone 7 that disrupts ORFs 8a and 8b and a three-nt deletion identified in S-ExoN1 clone 46 in ORF E are indicated above the lollipops by Δ30 and Δ3, respectively. All mutations identified in SARS-WT genomes occurred at nucleotide positions distinct from those in S-ExoN1 genomes. White boxes, nsp domains encoded by ORF1. For simplicity and because no mutations were detected in nsp11, a predicted 17-aa polypeptide that partly overlaps with the amino-terminus of nsp12, nsp11 is not shown. Dark gray boxes, ORFs encoding structural proteins: S, Spike attachment glycoprotein; E, Envelope protein; M, Membrane protein; N, Nucleocapsid protein. Light gray boxes, ORFs encoding group-specific (accessory) proteins.
Figure 6
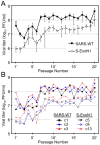
Figure 6. SARS-WT and S-ExoN1 titers across 20 population passages.
(A) Mean viral titers of three clones each of SARS-WT and S-ExoN1 at passages 1'-20'. Error bars indicate standard deviations. (B) Viral titers of individual clones of SARS-WT (closed symbols, solid lines) and S-ExoN1 (open symbols, dashed lines) at passages 1'-20'. At each passage Vero cells were infected at an MOI of 0.1 PFU/cell. Samples of culture medium were collected at 24 h p.i., titered by plaque assay at each passage, and transferred to naive cells.
Figure 7
Figure 7. Genetic diversity of SARS-WT and S-ExoN1 from P1', P5', and P10'.
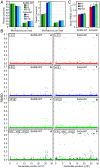
(A) The percentage of reads within each sample that have 0-1 (left) or 2–3 (right) mismatches compared to the corresponding reference sequence are shown. (B) RMSD plots. For each SARS-WT sample (a–d) or S-ExoN1 sample (e–h) the root mean squared deviation (RMSD) from the corresponding reference sequence is plotted for each nucleotide position in the genome. Plots are for P1' (a, e), P5' (b, f), P10' (c, g), or combined P1', P5', and P10' (d, h). The maximal RMSD value of 0.632 indicates completely different single-allelic distributions between experimental and reference sequences whereas values ≤0.0125 (dashed line) were considered background. (C) Summary RMSD values between SARS-WT P1', P5', or P10' or S-ExoN1 P1', P5', or P10' and reference sequences were calculated by computing the arithmetic mean of each RMSD value for every position in the genome. The 95% confidence intervals are indicated by error bars.

Similar articles

Cited by

References

    1. Drake JW, Holland JJ. Mutation rates among RNA viruses. Proc Natl Acad Sci U S A. 1999;96:13910–13913. - PMC - PubMed
    1. Bull JJ, Meyers LA, Lachmann M. Quasispecies made simple. e61PLoS Comput Biol. 2005;1 doi: 10.1371/journal.pcbi.0010061. - DOI - PMC - PubMed
    1. Domingo E, Sabo D, Taniguchi T, Weissmann C. Nucleotide sequence heterogeneity of an RNA phage population. Cell. 1978;13:735–744. - PubMed
    1. Dopazo J, Sobrino F, Palma EL, Domingo E, Moya A. Gene encoding capsid protein VP1 of foot-and-mouth disease virus: a quasispecies model of molecular evolution. Proc Natl Acad Sci U S A. 1988;85:6811–6815. - PMC - PubMed
    1. Pfeiffer JK, Kirkegaard K. Increased fidelity reduces poliovirus fitness and virulence under selective pressure in mice. e11PLoS Pathog. 2005;1 doi: 10.1371/journal.ppat.0010011. - DOI - PMC - PubMed

Publication types

MeSH terms

Substances