. 2009 Mar 1;170(1-3):4-12.
doi: 10.1016/j.elspec.2008.10.008.

An assessment of the resolution limitation due to radiation-damage in x-ray diffraction microscopy

Affiliations

An assessment of the resolution limitation due to radiation-damage in x-ray diffraction microscopy

M R Howells et al. J Electron Spectros Relat Phenomena. .

Abstract

X-ray diffraction microscopy (XDM) is a new form of x-ray imaging that is being practiced at several third-generation synchrotron-radiation x-ray facilities. Nine years have elapsed since the technique was first introduced and it has made rapid progress in demonstrating high-resolution three-dimensional imaging and promises few-nm resolution with much larger samples than can be imaged in the transmission electron microscope. Both life- and materials-science applications of XDM are intended, and it is expected that the principal limitation to resolution will be radiation damage for life science and the coherent power of available x-ray sources for material science. In this paper we address the question of the role of radiation damage. We use a statistical analysis based on the so-called "dose fractionation theorem" of Hegerl and Hoppe to calculate the dose needed to make an image of a single life-science sample by XDM with a given resolution. We find that for simply-shaped objects the needed dose scales with the inverse fourth power of the resolution and present experimental evidence to support this finding. To determine the maximum tolerable dose we have assembled a number of data taken from the literature plus some measurements of our own which cover ranges of resolution that are not well covered otherwise. The conclusion of this study is that, based on the natural contrast between protein and water and "Rose-criterion" image quality, one should be able to image a frozen-hydrated biological sample using XDM at a resolution of about 10 nm.


Figures

Fig. 1
Fig. 1
The surface dose in Gray for an incident x-ray fluence of 1 photon/μm2 for a range of x-ray energies. The material is taken to be protein of empirical formula H50C30N9O10S1 and density 1.35 gm/cm3.
Fig. 2
Fig. 2
(a) The x-ray fluence required to visualize a 10 nm cubic voxel of protein of empirical formula H50C30N9O10S1 and density 1.35 gm/cm3 against a background of water (blue, upper) and vacuum (green, lower) with a statistical accuracy defined by the Rose criterion. (b) the dose required to visualize a 10 nm cubic voxel of protein of empirical formula H50C30N9O10S1 and density 1.35 gm/cm3 against a background of water (blue, upper) and vacuum (green, lower) with a statistical accuracy defined by the Rose criterion.
Fig. 2
Fig. 2
(a) The x-ray fluence required to visualize a 10 nm cubic voxel of protein of empirical formula H50C30N9O10S1 and density 1.35 gm/cm3 against a background of water (blue, upper) and vacuum (green, lower) with a statistical accuracy defined by the Rose criterion. (b) the dose required to visualize a 10 nm cubic voxel of protein of empirical formula H50C30N9O10S1 and density 1.35 gm/cm3 against a background of water (blue, upper) and vacuum (green, lower) with a statistical accuracy defined by the Rose criterion.
Fig. 3
Fig. 3
Graph summarizing information on the required dose for imaging and the maximum tolerable dose. The required dose for imaging is calculated for protein of empirical formula H50C30N9O10S1 and density 1.35 gm/cm3 against a background of water for x-ray energies of 1 keV (lower continuous line) and 10 keV (upper continuous line). The dashed continuations of these lines refer to the transition region from coherent (d–4 scaling) to incoherent (d–3 scaling) behavior, both of which are shown down to 1 nm resolution. Some of our measurements of the required dose for imaging are plotted as crosses (see text and Fig. 4). The maximum tolerable dose is obtained from a variety of experiments by ourselves (see text) and from the literature as described in Table 1. The types of data from the literature are identified by the symbols as follows: filled circles: x-ray crystallography, filled triangles: electron crystallography, open circles: single-particle reconstruction, open triangles: electron tomography, diamonds: soft x-ray microscopy (including XDM), filled squares: ribosome experiment (see text and Fig. 5).
Fig. 4
Fig. 4
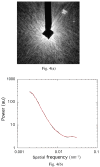
Representations of steps in the experimental determination of the required dose for imaging using freeze-dried yeast cells. (a) a typical diffraction pattern, (b) a radially averaged power spectrum of a pattern (with a polynomial fit), from which the cut-off frequency can be obtained and (c) two plots of normalized cut-off frequency versus normalized dose, the meaning of which is discussed in the text.
Fig. 4
Fig. 4
Representations of steps in the experimental determination of the required dose for imaging using freeze-dried yeast cells. (a) a typical diffraction pattern, (b) a radially averaged power spectrum of a pattern (with a polynomial fit), from which the cut-off frequency can be obtained and (c) two plots of normalized cut-off frequency versus normalized dose, the meaning of which is discussed in the text.
Fig. 5
Fig. 5
Three of twenty six spot patterns recorded in the spot-fading experiment described in the text. They were recorded from a ribosome crystal using beam line 8.3.1 at the Advanced Light Source at The Lawrence Berkeley National Laboratory. The accumulated dose prior to the recording is shown in the top left of the picture. Many of the spots seen at the beginning of the sequence (a) have faded by the middle (b) and essentially all are gone by the end (c). The full sequence can be seen as a movie at http://bl831.als.lbl.gov/∼jamesh/ribo_blast/diffraction.gif.

References

    1. Barty A, Marchesini S, Chapman HN, Cu C, Howells MR, Shapiro DA, Minor AM, Spence JCH, Weierstall U, Noy JI, Hau-Riege SP, Artyukhin AB, Baumann T, Willey T, Stolken J, vanBuuren T, Kinney JH. Three-Dimensional Coherent X-Ray Diffraction Imaging of a Ceramic Nanofoam: Determination of Structural Deformation Mechanisms. Phys Rev Lett. 2008;101:055501. - PubMed
    1. Baruchel J, Bleuet P, Bravin A, Coan P, Lima E, Madsen A, Ludwig W, Pernot P, Susini J. Advances in synchrotron hard X-ray based imaging. Comptes Rendus Physique. 2008;9:624–641.
    1. Beetz T, Howells MR, Jacobsen C, Kao CC, Kirz J, Lima E, Mentes TO, Miao H, Sanchez-Hanke C, Sayre D, Shapiro D. Apparatus for X-ray diffraction microscopy and tomography of cryo specimens. Nucl Instrum Meth A. 2005;545:459–468.
    1. Bergh M, Huldt G, Tîmneanu N, Maia F, Hajdu J. Feasibility of Imaging Living Cells at Sub-Nanometer Resolutions by Ultra-fast X-ray Diffraction. Quarterly Review of Biophysics. 2008 accepted. - PubMed
    1. Burmeister WP. Structural changes in a cryo-cooled protein crystal owing to radiation damage. Acta Cryst. 2000;D56:328–341. - PubMed

LinkOut - more resources