

Mutation bias favors protein folding stability in the evolution of small populations
- PMID: 20463869
- PMCID: PMC2865504
- DOI: 10.1371/journal.pcbi.1000767
Mutation bias favors protein folding stability in the evolution of small populations
Abstract
Mutation bias in prokaryotes varies from extreme adenine and thymine (AT) in obligatory endosymbiotic or parasitic bacteria to extreme guanine and cytosine (GC), for instance in actinobacteria. GC mutation bias deeply influences the folding stability of proteins, making proteins on the average less hydrophobic and therefore less stable with respect to unfolding but also less susceptible to misfolding and aggregation. We study a model where proteins evolve subject to selection for folding stability under given mutation bias, population size, and neutrality. We find a non-neutral regime where, for any given population size, there is an optimal mutation bias that maximizes fitness. Interestingly, this optimal GC usage is small for small populations, large for intermediate populations and around 50% for large populations. This result is robust with respect to the definition of the fitness function and to the protein structures studied. Our model suggests that small populations evolving with small GC usage eventually accumulate a significant selective advantage over populations evolving without this bias. This provides a possible explanation to the observation that most species adopting obligatory intracellular lifestyles with a consequent reduction of effective population size shifted their mutation spectrum towards AT. The model also predicts that large GC usage is optimal for intermediate population size. To test these predictions we estimated the effective population sizes of bacterial species using the optimal codon usage coefficients computed by dos Reis et al. and the synonymous to non-synonymous substitution ratio computed by Daubin and Moran. We found that the population sizes estimated in these ways are significantly smaller for species with small and large GC usage compared to species with no bias, which supports our prediction.
Conflict of interest statement
The authors have declared that no competing interests exist.
Figures
 (largest
  ) and
) and  (largest
  ).
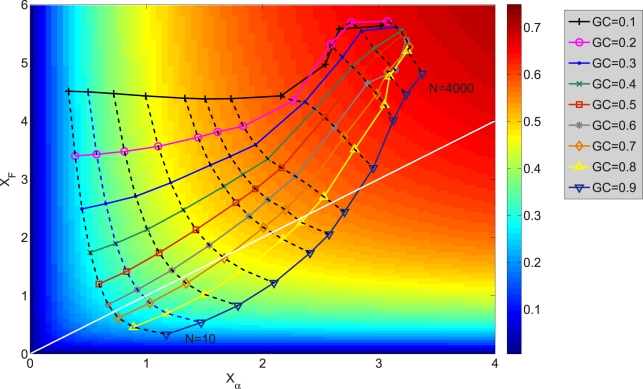
).  grows and
  decreases with
  . The sets of points joined with dashed lines correspond to constant population size
  , from
  (smallest stability) to
  (largest stability). Both stability variables
  increase with
  . Data points are superimposed to a heat map of the fitness function, showing that fitness increases with
  . However, constant
  lines do not correspond to constant fitness, but there are small variations, from which the optimal GC usage is derived. The solid white line shows
  at which the selective pressures on
  and
and  balance. One can see that, at large
  ,
,  is smaller than
  for all
  , so that the selective pressure is stronger on the former.
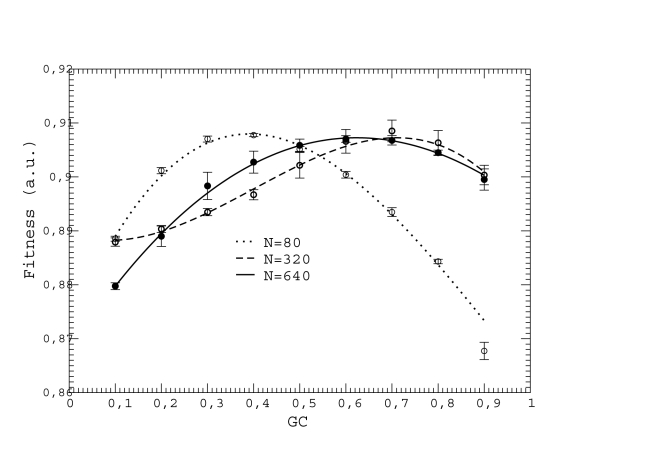
 by cubic fits, which are plotted as dotted, dashed, and solid lines.
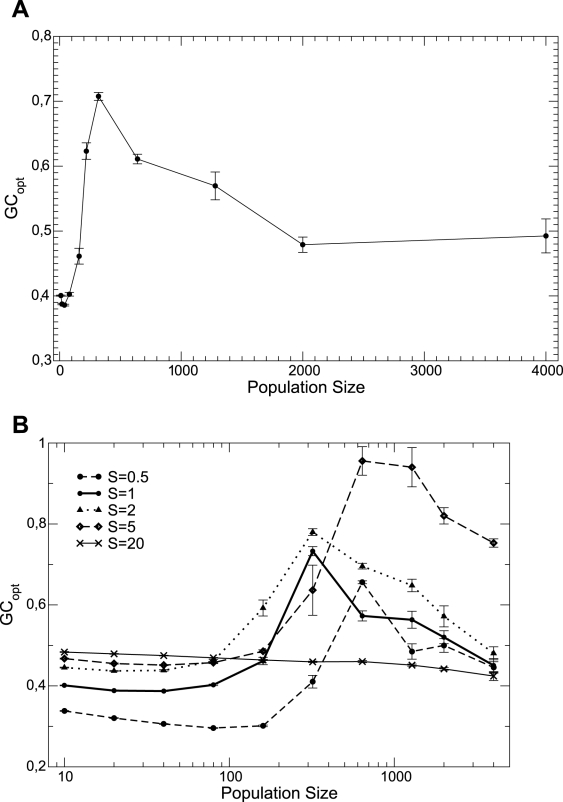
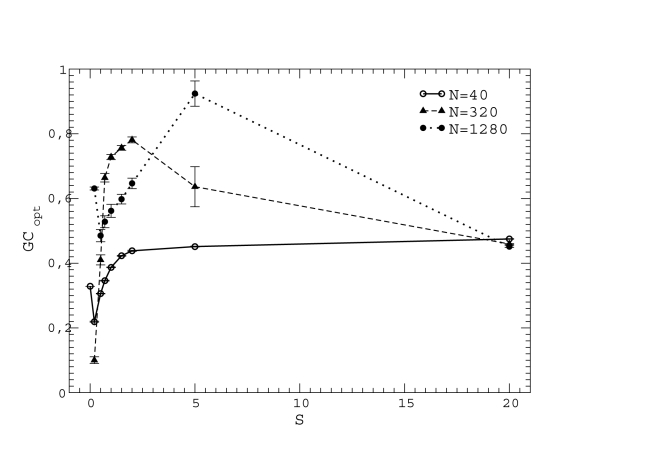
 and the bottom plot shows
  and 20. Interpolating lines are drawn as a guide to the eye.
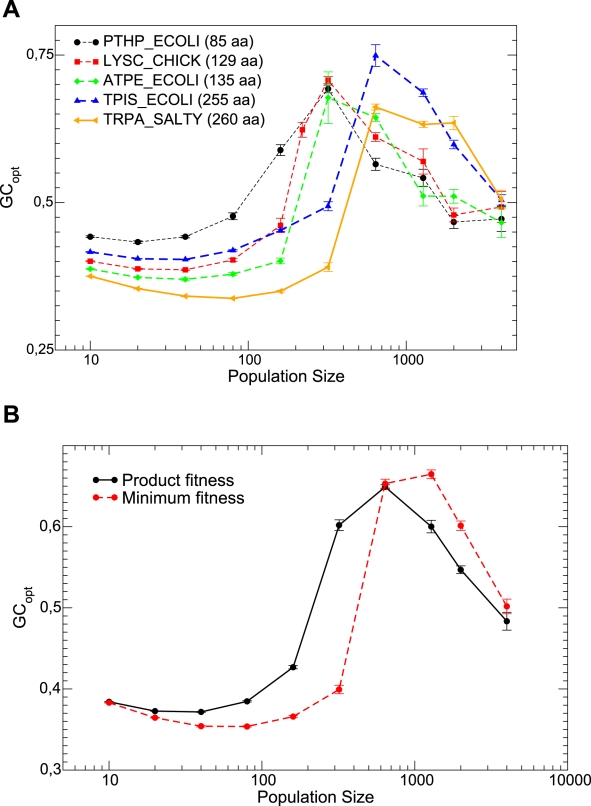
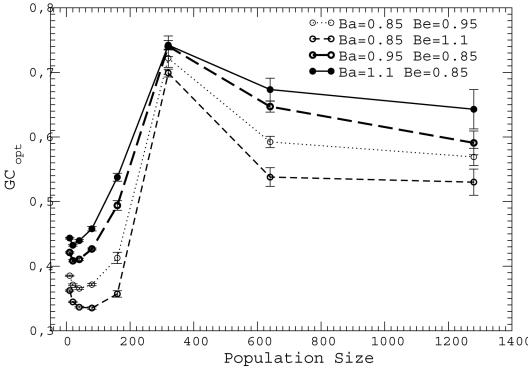
 for either
  of
of  . We only show four combinations since all other curves are contained between them.
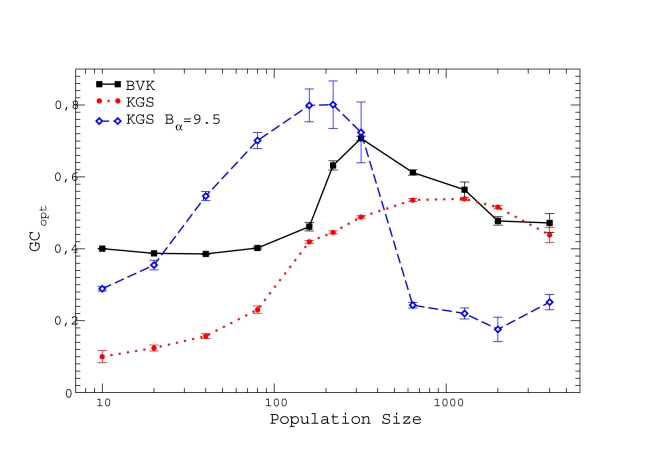
 for BVK parameters and
  for GKS. The coefficient of the neutral threshold is
  for the dotted curve and
  for the dashed curve. Other parameters are fixed at
  ,
,  .
.
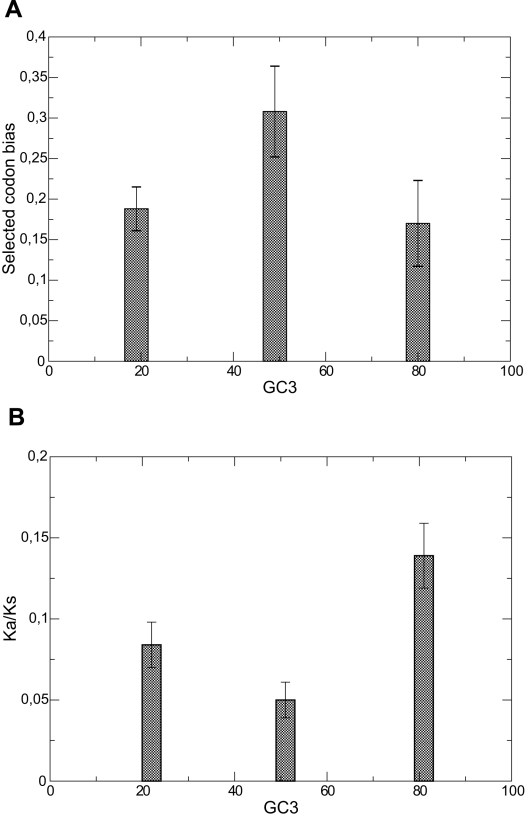
 (
( ,
,  (
( ) and
) and  (
( ). Bottom plot: values of
  computed by Daubin and Moran are averaged for pairs of bacteria with low, intermediate and high GC content. Both plots support the notion that species with GC content
  are characterized by larger effective population size.
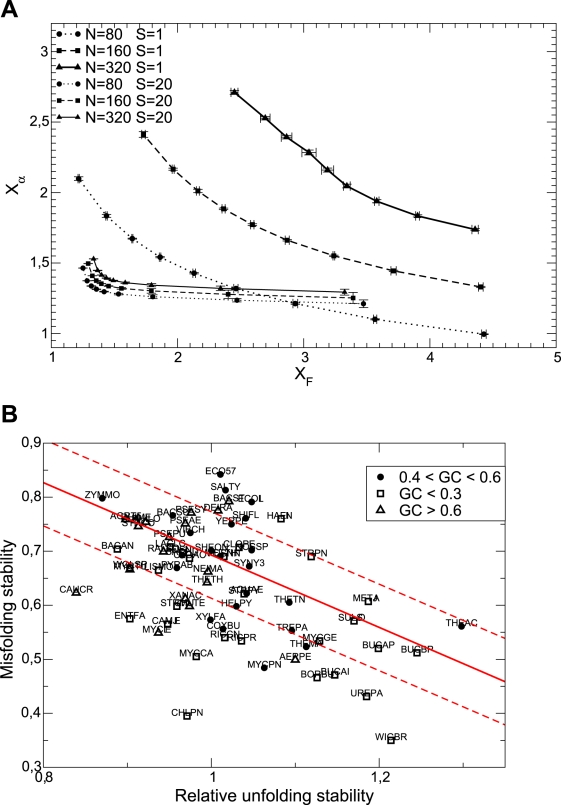
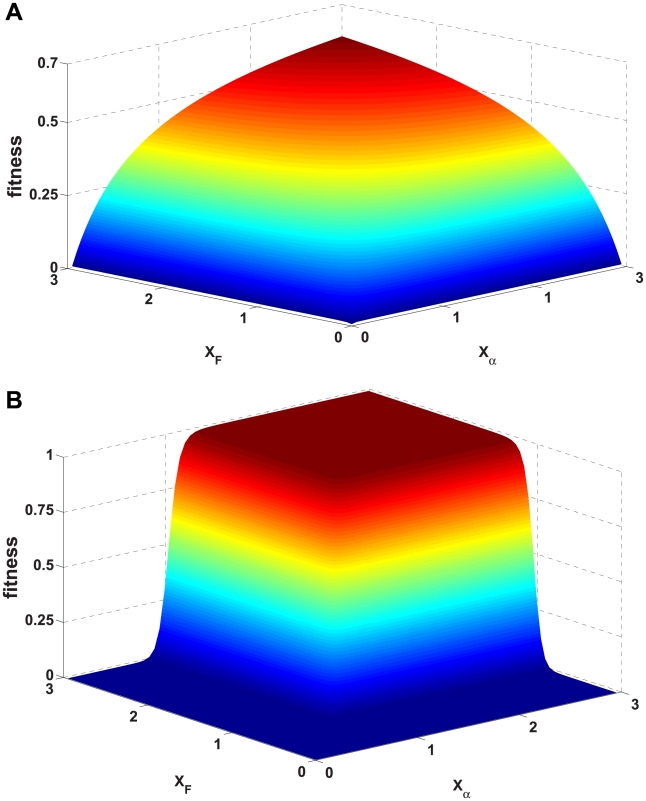
 versus unfolding stability
  for various mutation biases, three population sizes and neutrality exponent
  (non-neutral regime) and
  (neutral regime). Bottom plot: Estimated misfolding versus unfolding stability for families of homologous proteins in prokaryotic genomes (data from Ref. [12]). We distinguish genomes according to
  content at third codon position. The solid line represents a linear fit of misfolding stability for genomes with moderate or no mutation bias (
 ).
).
Similar articles
-
Evolution of Codon Usage Bias in Diatoms.Genes (Basel). 2019 Nov 6;10(11):894. doi: 10.3390/genes10110894. Genes (Basel). 2019. PMID: 31698749 Free PMC article.
-
Genomic determinants of protein folding thermodynamics in prokaryotic organisms.J Mol Biol. 2004 Nov 5;343(5):1451-66. doi: 10.1016/j.jmb.2004.08.086. J Mol Biol. 2004. PMID: 15491623
-
A general model of codon bias due to GC mutational bias.PLoS One. 2010 Oct 27;5(10):e13431. doi: 10.1371/journal.pone.0013431. PLoS One. 2010. PMID: 21048949 Free PMC article.
-
Codon usage bias.Mol Biol Rep. 2022 Jan;49(1):539-565. doi: 10.1007/s11033-021-06749-4. Epub 2021 Nov 25. Mol Biol Rep. 2022. PMID: 34822069 Free PMC article. Review.
-
New insights into the factors affecting synonymous codon usage in human infecting Plasmodium species.Acta Trop. 2017 Dec;176:29-33. doi: 10.1016/j.actatropica.2017.07.025. Epub 2017 Jul 24. Acta Trop. 2017. PMID: 28751162 Review.
Cited by
-
Genetic code evolution reveals the neutral emergence of mutational robustness, and information as an evolutionary constraint.Life (Basel). 2015 Apr 24;5(2):1301-32. doi: 10.3390/life5021301. Life (Basel). 2015. PMID: 25919033 Free PMC article.
-
Evolutionary interplay between structure, energy and epistasis in the coat protein of the ϕX174 phage family.J R Soc Interface. 2017 Jan;14(126):20160139. doi: 10.1098/rsif.2016.0139. J R Soc Interface. 2017. PMID: 28053111 Free PMC article.
-
Maximum-Likelihood Phylogenetic Inference with Selection on Protein Folding Stability.Mol Biol Evol. 2015 Aug;32(8):2195-207. doi: 10.1093/molbev/msv085. Epub 2015 Apr 2. Mol Biol Evol. 2015. PMID: 25837579 Free PMC article.
-
Evolution of molecular error rates and the consequences for evolvability.Proc Natl Acad Sci U S A. 2011 Jan 18;108(3):1082-7. doi: 10.1073/pnas.1012918108. Epub 2011 Jan 3. Proc Natl Acad Sci U S A. 2011. PMID: 21199946 Free PMC article.
-
Aerobic prokaryotes do not have higher GC contents than anaerobic prokaryotes, but obligate aerobic prokaryotes have.BMC Evol Biol. 2019 Jan 28;19(1):35. doi: 10.1186/s12862-019-1365-8. BMC Evol Biol. 2019. PMID: 30691392 Free PMC article.
References
-
- Kimura M. Evolutionary rate at the molecular level. Nature. 1968;217:624–626. - PubMed
-
- Kimura M. The neutral theory of molecular evolution. Cambridge Univ. Press; 1983.
-
- Taverna DM, Goldstein RA. Why are proteins marginally stable? Proteins. 2002;46:105–109. - PubMed
-
- Muller HJ. Some Genetic Aspects of Sex. American Naturalist. 1932;66:118–138.
