. 2010 May 6;6(5):e1000777.
doi: 10.1371/journal.pcbi.1000777.

A differentiation-based phylogeny of cancer subtypes

Affiliations

A differentiation-based phylogeny of cancer subtypes

Markus Riester et al. PLoS Comput Biol. .

Abstract

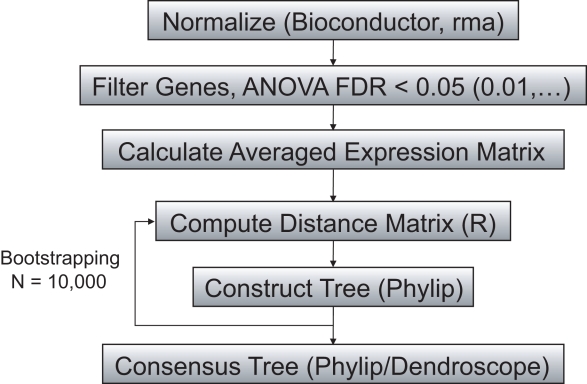
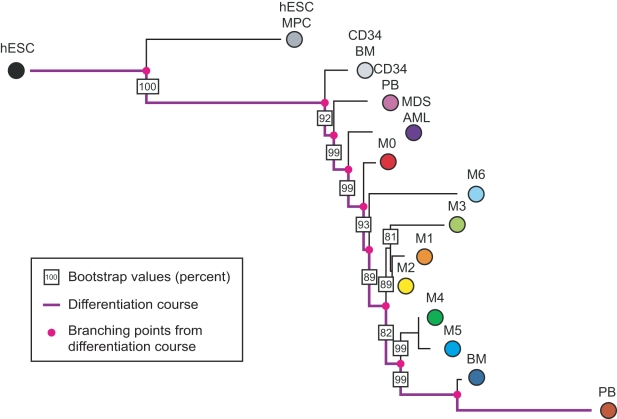
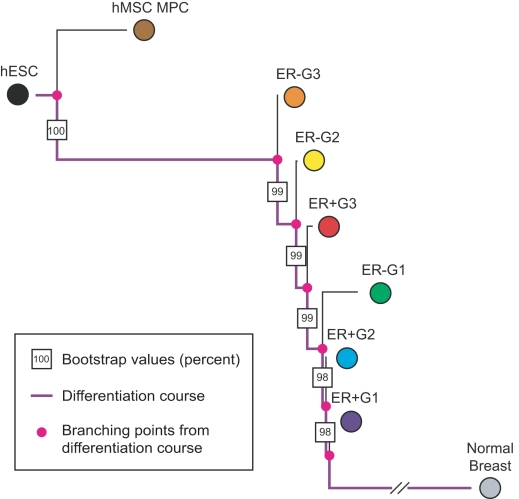
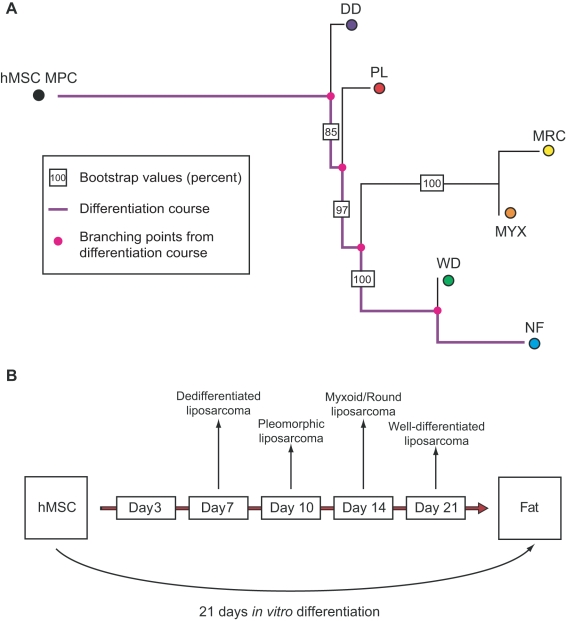
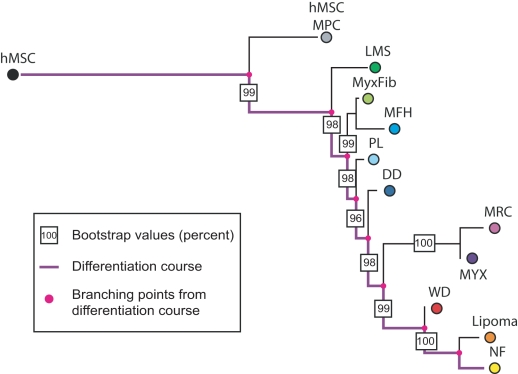
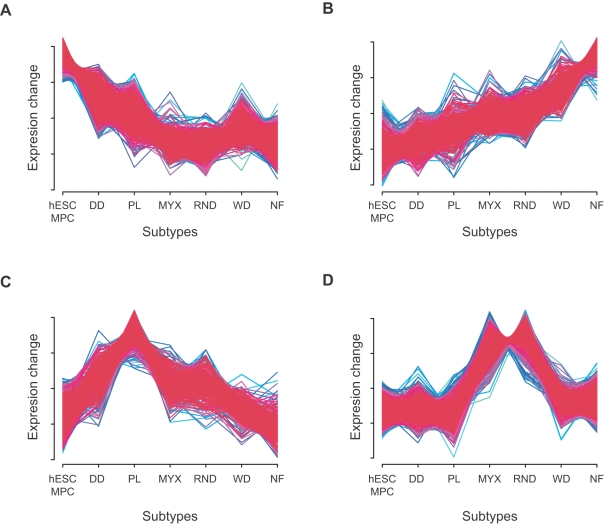
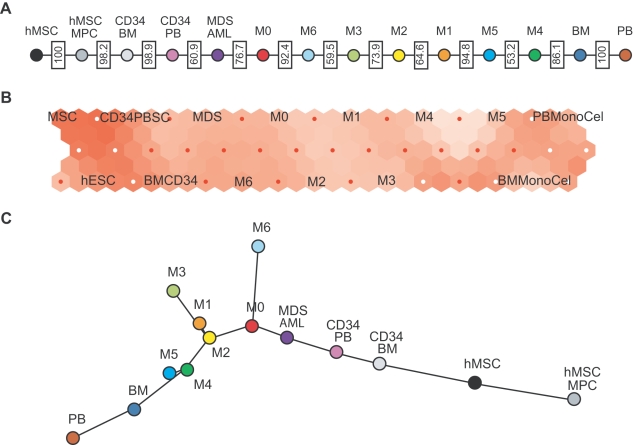
Histopathological classification of human tumors relies in part on the degree of differentiation of the tumor sample. To date, there is no objective systematic method to categorize tumor subtypes by maturation. In this paper, we introduce a novel computational algorithm to rank tumor subtypes according to the dissimilarity of their gene expression from that of stem cells and fully differentiated tissue, and thereby construct a phylogenetic tree of cancer. We validate our methodology with expression data of leukemia, breast cancer and liposarcoma subtypes and then apply it to a broader group of sarcomas. This ranking of tumor subtypes resulting from the application of our methodology allows the identification of genes correlated with differentiation and may help to identify novel therapeutic targets. Our algorithm represents the first phylogeny-based tool to analyze the differentiation status of human tumors.


Conflict of interest statement

The authors have declared that no competing interests exist.

Figures

Figure 1
Figure 1. Schematic outline of the methodology.
The flow chart shows the main steps of the algorithm used to construct a phylogenetic tree of tumor subtypes. First, the data is normalized using the Bioconductor software. Then ANOVA is used to identify those genes that are differentially expressed in at least one tumor subtype; we use a False Discovery Rate (FDR) of less than 0.01. Afterwards, the expression of each differentially expressed gene is averaged across all samples of each subtype. Those average expression levels are then used to compute the distance matrix of the subtypes, which is in turn utilized to construct a phylogenetic tree using the Phylip or FastME software. To determine the consensus tree, the phylogenetic construction is repeated 10,000 times using different sets of differentially expressed genes (of varying number). The consensus tree produced with this bootstrapping approach is visualized with the Dendroscope software.
Figure 2
Figure 2. A phylogeny of acute myeloid leukemia (AML) subtypes.
According to the French-American-British (FAB) classification, AML samples are classified into seven different types according to their level of differentiation (see Table 1). Expression data from 362 AML patients and 7 Myelodysplastic Syndrome (MDS-AML) patients is used to construct a phylogeny of these leukemias. We include expression data of human embryonic stem cells (hESCs), CD34+ cells from bone marrow (CD34 BM) and peripheral blood (CD34 PB), and mononuclear cells from bone marrow (BM) and peripheral blood (PB). The differentiation pathway from hESCs to mononuclear cells from peripheral blood is represented in purple, and the common ancestors of subtypes are shown as pink dots. The bootstrap values of branches are indicated by boxed numbers, representing the percentage of bootstrapping trees containing this branch. The ranking of AML subtypes identified by the phylogenetic algorithm corresponds with the differentiation status indicated by the FAB classification. The M6 subtype, represented by only 10 samples in our dataset, has the least stable branch, leading to lower bootstrap values for those branches where it can alternatively be located.
Figure 3
Figure 3. A phylogeny of breast cancer subgroups.
The figure shows the consensus tree of breast cancer subgroups. We use expression data of 483 breast cancer samples subdivided as shown in Table 2. The tree is rooted with expression data of human mesenchymal stem cells (hMSCs). We also include expression data of fully differentiated normal breast tissue. The differentiation pathway from hESC to fully differentiated breast tissue is indicated in purple, and the pink dots represent the common ancestors of (sets of) subgroups. The boxed numbers specify the bootstrap values of branches. The phylogeny ranks the breast cancer subtypes according to their dissimilarity from stem cells as ER− grade 3, ER− grade 2, ER+ grade 3, followed by ER− grade 1, ER+ grade 2 and ER+ grade 1.
Figure 4
Figure 4. A phylogeny of liposarcoma subtypes.
(a) The figure shows the consensus tree of liposarcoma subtypes. The tree is rooted with expression data of human mesenchymal stem cells (hMSC), and expression data of normal fat cells is included as well. The differentiation pathway from hMSC to normal fat cells is represented in purple. The pink points represent common ancestors of (sets of) subtypes. The boxed numbers specify bootstrap values of branches. The tree indicates that dedifferentiated liposarcoma is most similar to stem cells, followed by pleomorphic, myxoid, round-cell, and finally well-differentiated liposarcoma. (b) The figure shows a schematic representation of the correlation of adipogenesis to liposarcoma differentiation. In , human mesenchymal stem cells were differentiated in vitro to produce fat cells, and gene expression was measured for five different time points during the differentiation. The expression data of four different liposarcoma subtypes was then compared to the data obtained from the differentiation time course. This comparison identified dedifferentiated liposarcoma as the subtype most similar to stem cells, followed by pleomorphic, myxoid/round-cell, and well-differentiated liposarcoma. The correspondence between the results of our algorithm applied to gene expression datasets and these experimentally derived results serves as a validation of our methodology. Adapted from .
Figure 5
Figure 5. A phylogeny of sarcoma subtypes.
The figure shows the consensus tree of sarcoma subtypes. We use expression data of 251 sarcoma samples classified into the types shown in Table 3. The tree is rooted with expression data of human embryonic stem cells (hESCs). We also include expression data of human mesenchymal stem cells (hMSC) and of fully differentiated normal adipocytes. The differentiation pathway from hESC to fully differentiated adipocytes is indicated in purple, and the pink dots represent the common ancestors of (sets of) subtypes. The boxed numbers specify the bootstrap values of branches. The phylogeny ranks the sarcoma subtypes according to their dissimilarity from stem cells as leiomyosarcoma, malignant fibrous histiocytoma, myxofibrosarcoma, followed by the liposarcoma subtypes dedifferentiated liposarcoma, pleomorphic, myxoid/round-cell, and well-differentiated liposarcoma. Lipoma is identified as the subtype most dissimilar from stem cells.
Figure 6
Figure 6. Clusters of gene expression profiles.
The figure shows four example groups of differentially expressed genes clustered according to their expression profiles (see Methods section for details on the clustering algorithm). On the horizontal axis, we show the liposarcoma subtypes ordered according to the ranking identified by the phylogenetic approach (see Fig. 4a) and in the vertical axis the corresponding standard normalized average expression values of the subtypes. We also include human embryonic stem cells (hESCs) and normal fat cells. The expression of some genes continuously decreases from less differentiated samples (hESC, dedifferentiated liposarcoma, …) to more differentiated samples (…, well-differentiated liposarcoma, normal fat) (a), while the expression of other genes increases (b). Other genes are overexpressed in just a single liposarcoma subtype (c) or in a subset of subtypes (d). Those genes whose expression continuously increases or decreases are hypothesized to be related to adipogenesis (see Table 4).
Figure 7
Figure 7. Alternate distance based methods applied to acute myeloid leukemia (AML) data.
(a) The figure shows the results of a simple algorithm that sorts the AML subtypes by their distance to hESC. The algorithm uses the same distances as the ones for the phylogenetic tree shown in Fig. 2. (b) Self-Organizing Maps. The AML subtypes are arranged on a hexagonal grid of 15×3 nodes. These nodes are visualized by the small red or white dots. The colors visualize the difference of neighboring nodes. For example, the light nodes surrounding M4 and M5 show that these subtypes are similar. MSC and CD34+ peripheral blood, however, show very different expression patterns despite the fact that they are ordered close together on the map. (c) Minimum Spanning Tree (MST) calculation of the Pearson correlation matrix of the AML dataset.

Similar articles

Cited by

References

    1. Hanahan D, Weinberg RA. The hallmarks of cancer. Cell. 2000;100:57–70. - PubMed
    1. Bennett JM, Catovsky D, Daniel MT, Flandrin G, Galton DA, et al. Proposals for the classification of the acute leukaemias. French-American-British (FAB) co-operative group. Br J Haematol. 1976;33:451–458. - PubMed
    1. Kooby DA, Antonescu CR, Brennan MF, Singer S. Atypical lipomatous tumor/well-differentiated liposarcoma of the extremity and trunk wall: importance of histological subtype with treatment recommendations. Ann Surg Oncol. 2004;11:78–84. - PubMed
    1. Singer S, Antonescu CR, Riedel E, Brennan MF. Histologic subtype and margin of resection predict pattern of recurrence and survival for retroperitoneal liposarcoma. Ann Surg. 2003;238:358–370; discussion 370–351. - PMC - PubMed
    1. Dalal KM, Kattan MW, Antonescu CR, Brennan MF, Singer S. Subtype specific prognostic nomogram for patients with primary liposarcoma of the retroperitoneum, extremity, or trunk. Ann Surg. 2006;244:381–391. - PMC - PubMed

Publication types