. 2010 May 6;6(5):e1000938.
doi: 10.1371/journal.pgen.1000938.

Myeloid cell-restricted insulin receptor deficiency protects against obesity-induced inflammation and systemic insulin resistance

Affiliations

Myeloid cell-restricted insulin receptor deficiency protects against obesity-induced inflammation and systemic insulin resistance

Jan Mauer et al. PLoS Genet. .

Abstract

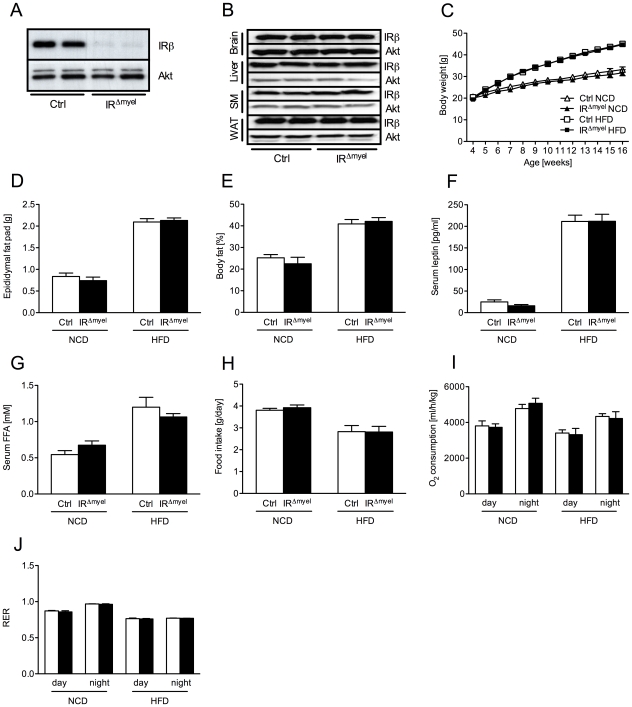
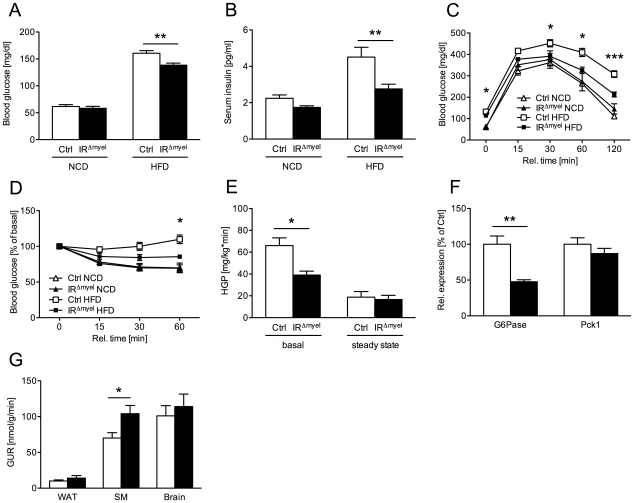
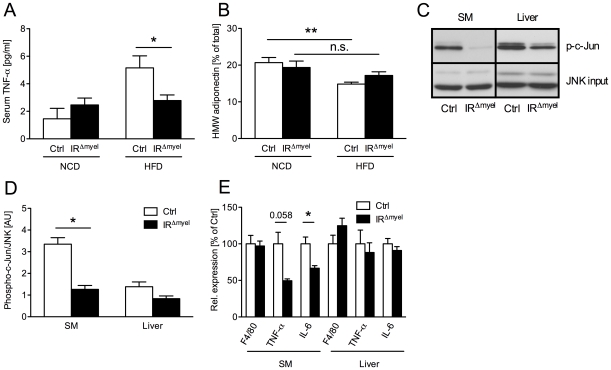
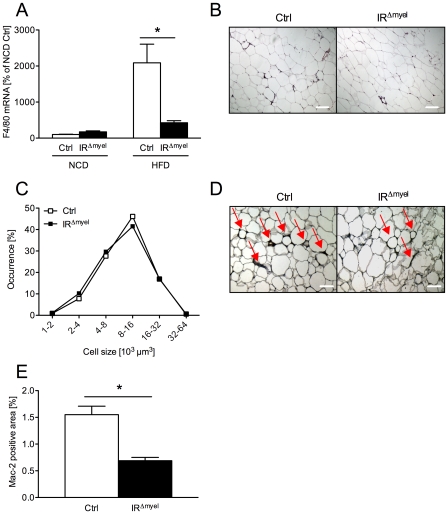
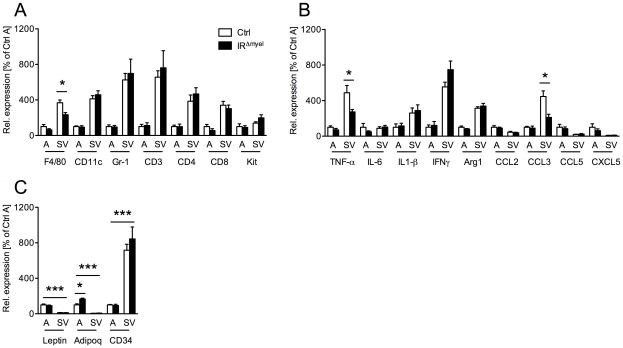
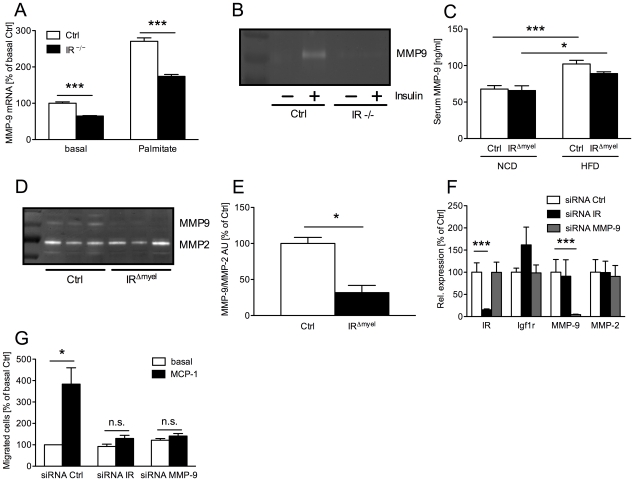
A major component of obesity-related insulin resistance is the establishment of a chronic inflammatory state with invasion of white adipose tissue by mononuclear cells. This results in the release of pro-inflammatory cytokines, which in turn leads to insulin resistance in target tissues such as skeletal muscle and liver. To determine the role of insulin action in macrophages and monocytes in obesity-associated insulin resistance, we conditionally inactivated the insulin receptor (IR) gene in myeloid lineage cells in mice (IR(Deltamyel)-mice). While these animals exhibit unaltered glucose metabolism on a normal diet, they are protected from the development of obesity-associated insulin resistance upon high fat feeding. Euglycemic, hyperinsulinemic clamp studies demonstrate that this results from decreased basal hepatic glucose production and from increased insulin-stimulated glucose disposal in skeletal muscle. Furthermore, IR(Deltamyel)-mice exhibit decreased concentrations of circulating tumor necrosis factor (TNF) alpha and thus reduced c-Jun N-terminal kinase (JNK) activity in skeletal muscle upon high fat feeding, reflecting a dramatic reduction of the chronic and systemic low-grade inflammatory state associated with obesity. This is paralleled by a reduced accumulation of macrophages in white adipose tissue due to a pronounced impairment of matrix metalloproteinase (MMP) 9 expression and activity in these cells. These data indicate that insulin action in myeloid cells plays an unexpected, critical role in the regulation of macrophage invasion into white adipose tissue and in the development of obesity-associated insulin resistance.


Conflict of interest statement

The authors have declared that no competing interests exist.

Figures

Figure 1
Figure 1. IRΔmyel-mice exhibit unaltered response to normal chow and high fat diet.
(A) Western blot analysis of insulin receptor (IR) β and Akt (loading control) expression in thioglycollate-elicited macrophages of control- and IRΔmyel-mice. (B) Western blot analysis of IR-β and Akt (loading control) in brain, liver, skeletal muscle (SM) and white adipose tissue (WAT) of control- and IRΔmyel-mice. (C) Weight curves of male control- and IRΔmyel-mice fed NCD or HFD. (n = 12 mice per genotype on NCD; n = 32 mice per genotype on HFD.) (D) Epididymal fat pad mass of male control- and IRΔmyel-mice fed either NCD or HFD. (n = 15 mice per genotype and diet.) (E) Body fat content of male control- and IRΔmyel-mice fed either NCD or HFD. (n = 4–10 mice per genotype and diet.) (F) Serum leptin concentrations of male control- and IRΔmyel-mice fed either NCD or HFD. (n = 6–16 mice per genotype and diet.) (G) Serum free fatty acid (FFA) concentrations of male control- and IRΔmyel-mice fed either NCD or HFD. (n = 10–12 mice per genotype and diet.) (H) Daily food intake of male control- and IRΔmyel-mice fed either NCD or HFD. (n = 4–10 mice per genotype and diet.) (I) Oxygen (O2) consumption of male control- and IRΔmyel-mice fed either NCD or HFD. (n = 4–10 mice per genotype and diet.) (J) Respiratory exchange ratio (RER) of male control- and IRΔmyel-mice fed either NCD or HFD. (n = 4–10 mice per genotype and diet.) (Results are means ± SEM; white bars represent controls and black bars represent IRΔmyel-mice).
Figure 2
Figure 2. IRΔmyel-mice are protected against obesity-induced insulin resistance.
(A) Fasted blood glucose concentrations of male control- and IRΔmyel-mice fed either NCD or HFD. (n = 6–7 mice per genotype on NCD; n = 33–36 mice per genotype on HFD.) (B) Fasted serum insulin concentrations of male control- and IRΔmyel-mice fed either NCD or HFD. (n = 6–7 mice per genotype on NCD; n = 10 mice per genotype on HFD.) (C) Glucose Tolerance Tests were performed with male control- and IRΔmyel-mice fed NCD or HFD. (n = 6–13 mice per genotype and diet.) (D) Insulin Tolerance Tests were performed with male control- and IRΔmyel-mice fed NCD or HFD. (n = 4–11 mice per genotype and diet.) (E) Hepatic glucose production (HGP) of male, HFD-fed control- and IRΔmyel-mice before (basal) and during (steady state) euglycemic, hyperinsulinemic clamp analysis. (n = 12 mice per genotype.) (F) Relative expression of G6Pase and Pck1 mRNA in livers of fasted control- and IRΔmyel-mice fed HFD (n = 6 mice per genotype.) (G) Tissue-specific glucose uptake rate (GUR) of male, HFD-fed control- and IRΔmyel-mice under steady state conditions. (WAT = white adipose tissue; SM = skeletal muscle; n = 10 mice per genotype.) (Results are means ± SEM; white bars represent controls and black bars represent IRΔmyel-mice; *p≤0.05; **p≤0.01; ***p≤0.001.)
Figure 3
Figure 3. The obesity-associated systemic pro-inflammatory state is reduced in IRΔmyel-mice.
(A) Serum TNF-α concentration in male control- and IRΔmyel-mice fed either NCD or HFD. (n = 12 mice per genotype on NCD; n = 21 mice per genotype on HFD.) (B) Percentage of serum high molecular weight (HMW) from total adiponectin in male control- and IRΔmyel-mice fed either NCD or HFD. (n = 10–12 mice per genotype and diet.) (C) In vitro phosphorylation of c-Jun (p-c-Jun) in skeletal muscle (SM) and liver lysates from male, HFD-fed control- and IRΔmyel-mice. Total JNK input was used as loading control. (representative western blot shown). (D) Densitometrical analysis of phospho-c-Jun vs total JNK. (AU = arbitrary units; SM = skeletal muscle; n = 6 mice per genotype.) (E) Relative expression of F4/80, TNF-α and IL-6 mRNA in skeletal muscle (SM) and liver of male, HFD-fed control- and IRΔmyel-mice. (n = 6 mice per genotype.) (Results are means ± SEM; white bars represent controls and black bars represent IRΔmyel-mice; *p≤0.05; **p≤0.01; n.s. = not significant.)
Figure 4
Figure 4. The obesity-associated macrophage infiltration into white adipose tissue is blunted in IRΔmyel-mice.
(A) Relative expression of F4/80 mRNA in WAT of male control- and IRΔmyel-mice fed either NCD or HFD. (n = 8 mice per genotype and diet.) (B) Hematoxylin and eosin staining of white adipose tissue (WAT) sections from male control- and IRΔmyel-mice fed HFD. (C) Adipocyte size distribution in WAT of male control- and IRΔmyel-mice fed HFD. (n = 9 mice per genotype.) (D) Mac-2 staining of WAT-sections from male control- and IRΔmyel-mice fed HFD; Red arrows indicate Mac-2 positive area surrounding the adipocytes. (E) Percentage of Mac-2 positive area per section in male control- and IRΔmyel-mice fed HFD. (n = 9 mice per genotype.) (Results are means ± SEM; white bars represent controls and black bars represent IRΔmyel-mice; *p≤0.05; scale bars = 200 µm.)
Figure 5
Figure 5. Obese IRΔmyel-mice exhibit reduced macrophage marker and pro-inflammatory gene expression in stromal vascular cells of the adipose tissue.
(A) Relative expression of immune cell markers F4/80, CD11c, Gr-1, CD3, CD4, CD8 and Kit mRNA in adipocytes (A) and stromal vascular (SV) fraction of male control- and IRΔmyel-mice fed HFD. (n = 5 mice per genotype.) (B) Relative expression of cytokines and chemokines TNF-α, IL-6, IL-1β, IFNγ, Arg1, CCL2/MCP1, CCL3/MIP1α, CCL5/Rantes and CXCL5 mRNA in adipocytes (A) and stromal vascular (SV) fraction of male control- and IRΔmyel-mice fed HFD. (n = 5 mice per genotype.) (C) Relative mRNA expression of adipocyte-specific genes leptin and adiponectin (adipoq) and stromal vascular cell-specific gene CD34 in adipocytes (A) and stromal vascular (SV) fraction of male control- and IRΔmyel-mice fed HFD. (n = 5 mice per genotype.) (Results are means ± SEM; white bars represent controls and black bars represent IRΔmyel-mice; *p≤0.05; ***p≤0.001.)
Figure 6
Figure 6. Myeloid cell-restricted insulin receptor deficiency leads to reduced matrix metalloproteinase (MMP) 9 expression in macrophages and white adipose tissue of IRΔmyel-mice.
(A) Relative expression of MMP-9 mRNA in peritoneal macrophages of control- and IRΔmyel-mice. Cells were left untreated (basal) or stimulated with palmitate (500 µM) for 4 h. (n = 3 independent experiments.) (B) Conditioned medium from 24 h untreated (basal) and insulin-stimulated (50 ng/ml) bone marrow-derived macrophages (BMDM) of control- and IRΔmyel-mice (IR −/−) was analyzed for MMP-9 gelatinolytic activtity. (representative zymogram of 3 independent experiments shown.) (C) Serum MMP-9 concentration in male control- and IRΔmyel-mice fed either NCD or HFD. (n = 10–12 mice per genotype and diet.) (D) White adipose tissue lysates from obese control- and IRΔmyel-mice were analyzed for gelatinolytic activity. (E) Densitometrical analysis of MMP-9 vs MMP-2 in zymograms of WAT from obese control- and IRΔmyel-mice. (AU = arbitrary units; n = 3.) (F) Relative expression of insulin receptor (IR), insulin-like growth factor 1 receptor (Igf1r), matrix metalloproteinase (MMP) 9 and MMP-2 mRNA in silenced BMDM. (white bars = siRNA Ctrl, black bars = siRNA IR, grey bars = siRNA MMP-9; n = 3.) (G) Chemotaxis of silenced BMDM through a gelatin matrix was analyzed using a transwell migration assay. (white bars = basal migration, black bars = migration against 100 ng/ml MCP-1; n = 3 independent experiments.) (Results are means ± SEM; white bars represent controls and black bars represent IR-deficient macrophages/IRΔmyel-mice unless stated otherwise; *p≤0.05; ***p≤0.001; n.s. = not significant.)

Similar articles

Cited by

References

    1. Hotamisligil GS, Arner P, Caro JF, Atkinson RL, Spiegelman BM. Increased adipose tissue expression of tumor necrosis factor-alpha in human obesity and insulin resistance. J Clin Invest. 1995;95:2409–2415. - PMC - PubMed
    1. Hotamisligil GS, Shargill NS, Spiegelman BM. Adipose expression of tumor necrosis factor-alpha: direct role in obesity-linked insulin resistance. Science. 1993;259:87–91. - PubMed
    1. Kern PA, Ranganathan S, Li C, Wood L, Ranganathan G. Adipose tissue tumor necrosis factor and interleukin-6 expression in human obesity and insulin resistance. Am J Physiol Endocrinol Metab. 2001;280:E745–751. - PubMed
    1. Kern PA, Saghizadeh M, Ong JM, Bosch RJ, Deem R, et al. The expression of tumor necrosis factor in human adipose tissue. Regulation by obesity, weight loss, and relationship to lipoprotein lipase. J Clin Invest. 1995;95:2111–2119. - PMC - PubMed
    1. Weisberg SP, McCann D, Desai M, Rosenbaum M, Leibel RL, et al. Obesity is associated with macrophage accumulation in adipose tissue. J Clin Invest. 2003;112:1796–1808. - PMC - PubMed

Publication types

Substances