. 2010 May 6;6(5):e1000940.
doi: 10.1371/journal.pgen.1000940.

Linkage and association mapping of Arabidopsis thaliana flowering time in nature

Affiliations

Linkage and association mapping of Arabidopsis thaliana flowering time in nature

Benjamin Brachi et al. PLoS Genet. .

Abstract

Flowering time is a key life-history trait in the plant life cycle. Most studies to unravel the genetics of flowering time in Arabidopsis thaliana have been performed under greenhouse conditions. Here, we describe a study about the genetics of flowering time that differs from previous studies in two important ways: first, we measure flowering time in a more complex and ecologically realistic environment; and, second, we combine the advantages of genome-wide association (GWA) and traditional linkage (QTL) mapping. Our experiments involved phenotyping nearly 20,000 plants over 2 winters under field conditions, including 184 worldwide natural accessions genotyped for 216,509 SNPs and 4,366 RILs derived from 13 independent crosses chosen to maximize genetic and phenotypic diversity. Based on a photothermal time model, the flowering time variation scored in our field experiment was poorly correlated with the flowering time variation previously obtained under greenhouse conditions, reinforcing previous demonstrations of the importance of genotype by environment interactions in A. thaliana and the need to study adaptive variation under natural conditions. The use of 4,366 RILs provides great power for dissecting the genetic architecture of flowering time in A. thaliana under our specific field conditions. We describe more than 60 additive QTLs, all with relatively small to medium effects and organized in 5 major clusters. We show that QTL mapping increases our power to distinguish true from false associations in GWA mapping. QTL mapping also permits the identification of false negatives, that is, causative SNPs that are lost when applying GWA methods that control for population structure. Major genes underpinning flowering time in the greenhouse were not associated with flowering time in this study. Instead, we found a prevalence of genes involved in the regulation of the plant circadian clock. Furthermore, we identified new genomic regions lacking obvious candidate genes.


Conflict of interest statement

The authors have declared that no competing interests exist.

Figures

Figure 1
Figure 1. Distribution of natural variation for flowering time.
For all frames of this figure, the x-axis gives the calendar dates from the 06th of October (∼mean germination date) to the 06th of June. The four panels in the figure are described from top to bottom. The top panel corresponds to the distribution of flowering time scored for the 184 natural accessions in 2007/2008 (blue) and 2008/2009 (red). The next panel gives the curves for photoperiod (in red), and the daily mean temperatures for 2007/2008 (blue solid line) and for 2008/2009 (blue dashed line). The next panel gives the photothermal units (PTU) accumulated from the beginning of germination to the end of the flowering season for 2007/2008 (red solid line) and for 2008/2009 (red dashed line). The accumulation of chilling degrees is represented over the same period (2007/2008: blue solid line, 2008/2009: blue dashed line). The equivalent accumulation in chilling degrees to 4, 8 and 12 weeks in a growth chamber at 4°C is indicated by blue dotted lines. The bottom panel gives the distribution of flowering time for each of the RIL families. For each RIL family, red bars extend from the minimum to the maximum values observed, with the larger ticks demarcating the median of the distribution and the smaller ticks indicating the flowering times for the parental lines.
Figure 2
Figure 2. Broad-sense heritability, number of QTLs, and percentage of phenotypic variation explained by additive or epistatic QTLs for each of the 13 RIL families.
H 2: broad-sense heritability (light grey bars). The percentage of phenotypic variation explained by additive and epistatic QTLs is illustrated by black and dark grey bars, respectively. The number of additive QTLs is indicated on the black bars.
Figure 3
Figure 3. Validation of additive QTLs found in the Bay-0×Shahdara RIL family by NILs.
Each of the 8 additive QTLs detected in the Bay-0×Shahdara RIL family is supported by 1 to 6 independent pairs of NILs (i.e. heterogeneous inbred families).
Figure 4
Figure 4. Distribution of the Col-0 additive allelic effect in the 2007–2008 field experiment.
Histogram of additive allele estimates for the flowering time for all the 12 RIL families that have Col-0 as a common parental line relative to Col-0.
Figure 5
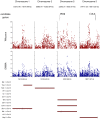
Figure 5. Comparison of GWA and traditional linkage mapping (additive QTLs) results for flowering time for chromosome 4.
The x-axis indicates the physical position along the chromosome. Top panel: Position of the 52 a priori candidate genes located on chromosome 4. Mid-panel: −log10 p-values from a chromosome 4-wide scan using either the Wilcoxon model or the EMMA method (blue and red dots, respectively). Bottom panel: QTL regions for each of the 13 RIL families. For each RIL family, green bars represent the 95% confidence interval for QTL position, with the bigger tick representing the QTL position. QTL clusters 2 and 3 are highlighted below the corresponding QTL regions.
Figure 6
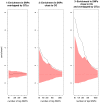
Figure 6. Enrichment ratios as a function of the number of top SNPs chosen in the GWA mapping results using the EMMA method.
The mean and the corresponding 95% confidence interval from the null distributions are represented by the dotted line and the colored areas, respectively. CG: candidate gene.
Figure 7
Figure 7. Peaks of associations with no candidate genes within a 20 kb region on either side of the top SNP (plotting window 400 kb).

Similar articles

Cited by

References

    1. Ducrocq S, Veyrieras J-B, Camus-Kulandaivelu L, Kloiber-Maitz M, Presterl T, et al. Key impact of Vgt1 on flowering time adaptation in maize: evidence from association mapping and ecogeographical information. Genetics. 2008;178:2433–2437. - PMC - PubMed
    1. Jones H, Leigh FJ, Mackay I, Bower MA, Smith LMJ, et al. Population-based resequencing reveals that the flowering time adaptation of cultivated barley originated east of the Fertile Crescent. Mol Biol Evol. 2008;25:2211–2219. - PubMed
    1. Stinchcombe JR, Weinig C, Ungerer M, Olsen KM, Mays C, et al. A latitudinal cline in flowering time in Arabidopsis thaliana modulated by the flowering time gene FRIGIDA. Proc Natl Acad Sci USA. 2004;101:4712–4717. - PMC - PubMed
    1. Uga Y, Nonoue Y, Liang Z, Lin H, Yamamoto S, et al. Accumulation of additive effects generates a strong photoperiod sensitivity in the extremely late-heading rice cultivar ‘Nona Bokra’. Theor Appl Genet. 2007;114:1457–1466. - PubMed
    1. Van Dijk H, Hautekèete N-C. Long day plants and the response to global warming: rapid evolutionary change in day length sensitivity is possible in wild beet. J Evol Biol. 2007;20:349–357. - PubMed

Publication types

Substances