. 2010 May 6;5(5):e10520.
doi: 10.1371/journal.pone.0010520.

Optimal pandemic influenza vaccine allocation strategies for the Canadian population

Affiliations

Optimal pandemic influenza vaccine allocation strategies for the Canadian population

Ashleigh R Tuite et al. PLoS One. .

Abstract

Background: The world is currently confronting the first influenza pandemic of the 21(st) century. Influenza vaccination is an effective preventive measure, but the unique epidemiological features of swine-origin influenza A (H1N1) (pH1N1) introduce uncertainty as to the best strategy for prioritization of vaccine allocation. We sought to determine optimal prioritization of vaccine distribution among different age and risk groups within the Canadian population, to minimize influenza-attributable morbidity and mortality.

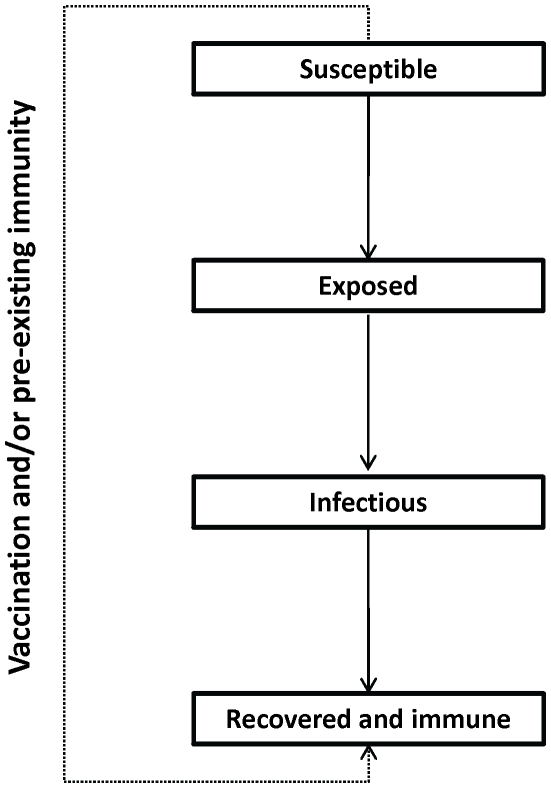
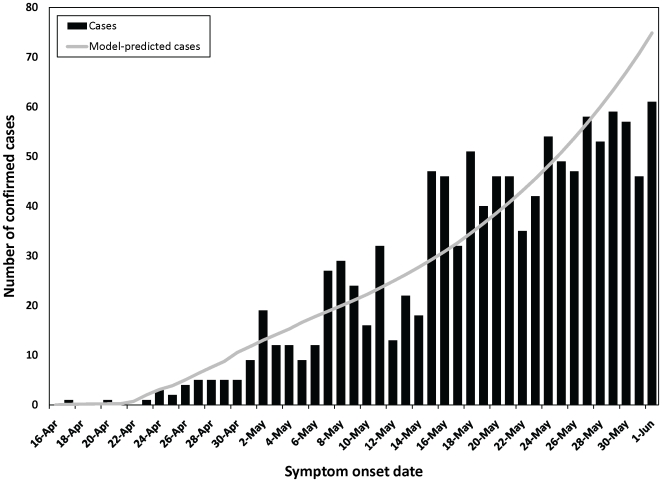
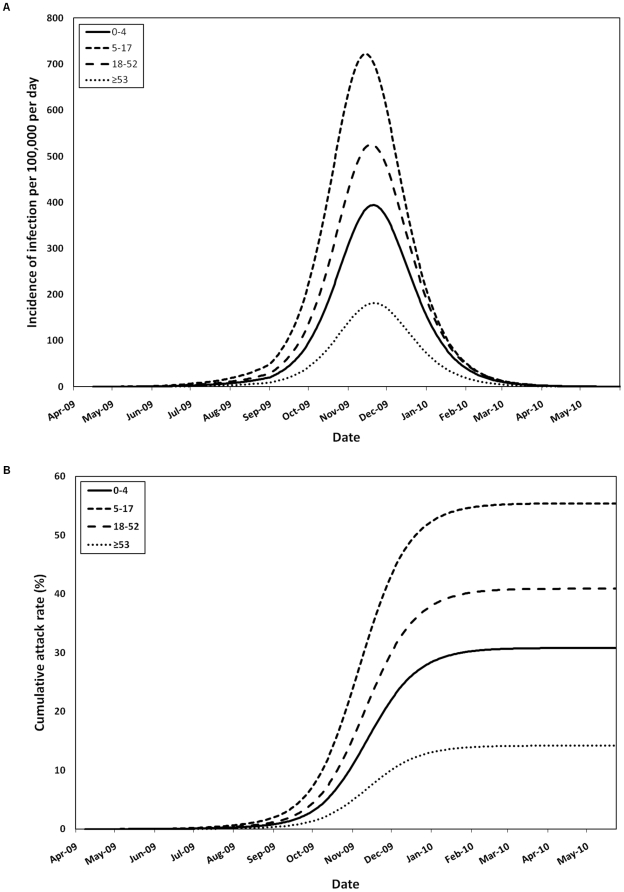
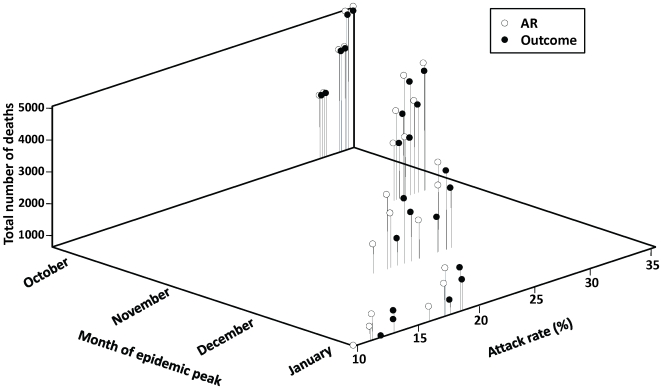
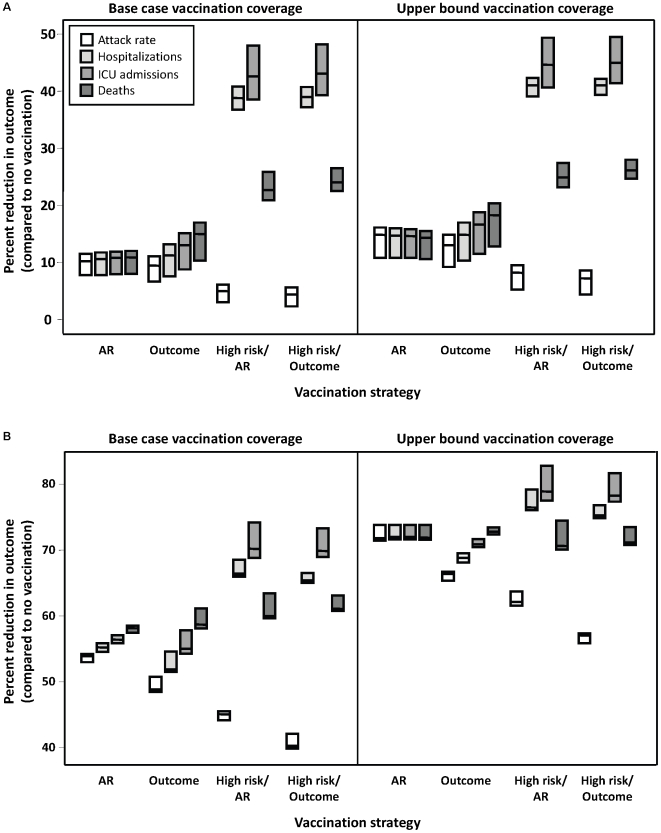
Methodology/principal findings: We developed a deterministic, age-structured compartmental model of influenza transmission, with key parameter values estimated from data collected during the initial phase of the epidemic in Ontario, Canada. We examined the effect of different vaccination strategies on attack rates, hospitalizations, intensive care unit admissions, and mortality. In all scenarios, prioritization of high-risk individuals (those with underlying chronic conditions and pregnant women), regardless of age, markedly decreased the frequency of severe outcomes. When individuals with underlying medical conditions were not prioritized and an age group-based approach was used, preferential vaccination of age groups at increased risk of severe outcomes following infection generally resulted in decreased mortality compared to targeting vaccine to age groups with higher transmission, at a cost of higher population-level attack rates. All simulations were sensitive to the timing of the epidemic peak in relation to vaccine availability, with vaccination having the greatest impact when it was implemented well in advance of the epidemic peak.

Conclusions/significance: Our model simulations suggest that vaccine should be allocated to high-risk groups, regardless of age, followed by age groups at increased risk of severe outcomes. Vaccination may significantly reduce influenza-attributable morbidity and mortality, but the benefits are dependent on epidemic dynamics, time for program roll-out, and vaccine uptake.


Conflict of interest statement

Competing Interests: David Fisman has received research funds from Sanofi-Pasteur, which manufactures an influenza H1N1 vaccine. This vaccine is not used in Canada and Sanofi-Pasteur has had no role in the drafting of this manuscript. This prior receipt of funding does not alter Dr. Fisman's adherence to all the PLoS ONE policies on sharing data and materials. Dr. Fisman affirms that he has no other relevant declarations relating to employment, consultancy, patents, or products. None of the other authors has any conflict of interest, or potential conflict of interest, associated with the publication of this manuscript.

Figures

Figure 1
Figure 1. Outline of model structure, showing population flows between compartments.
Each compartment is further stratified by age category (and by healthy and chronic condition states, where required).
Figure 2
Figure 2. Confirmed cases of locally-acquired pH1N1 in Ontario by symptom onset date, April 16–June 1, 2009.
Cases that reported a history of travel to Mexico prior to illness onset are not included. Model-predicted cases assuming 50 percent pre-existing immunity in the ≥53 age group, Re of 1.3, latent period of 3.5 days, and duration of infectiousness of 2.5 days are shown (line).
Figure 3
Figure 3. Model-predicted pH1N1 infection dynamics in the absence of vaccination.
(A) Simulated age-stratified daily pH1N1 infection incidence per 100,000 population and (B) age-specific attack rates between April 2009 and June 2010, in the absence of vaccination or other interventions. Both symptomatic and asymptomatic cases are shown. The curves are based on an assumption of fifty percent pre-existing immunity in the ≥53 age group and a decrease in Re from 1.3 to 1.15 between July and September.
Figure 4
Figure 4. Effect of timing of epidemic peak on preferred vaccination strategy.
Total model-predicted attack rates and deaths by month of the pandemic peak are shown, when implementing attack rate (AR)- or outcome-based vaccination strategies. For each month of the epidemic peak, outcomes are presented for three values of pre-existing immunity among individuals aged ≥53 (30%, 50%, and 70%) and two vaccination coverage levels (base case and upper bound). For all scenarios, vaccination campaigns are initiated on November 15, 2009.
Figure 5
Figure 5. Impact of vaccination strategy on model outcomes.
Percent reduction in attack rate, hospitalizations, ICU admissions, and total deaths, relative to no vaccination, under different vaccination strategies. The effectiveness of different strategies was evaluated assuming an epidemic peak in (A) November, 2009 or (B) January, 2010, with vaccination campaigns initiated on November 15, 2009. Results for October, 2009 and December, 2009 were similar to November, 2009 and January, 2010, respectively, and are not shown. The impact of vaccination coverage is also shown, with base case rates representing the lower bound of vaccine uptake in the Canadian population, compared to likely upper limits of vaccine uptake. The midpoint of the boxes represents the median percent reduction in the outcome of interest, with the upper and lower bounds representing the maximum and minimum reductions, respectively, under varying assumptions of pre-existing immunity in individuals aged ≥53 (i.e., 30%, 50%, or 70%). Details of the different vaccination strategies (AR, Outcome, High risk/AR, High risk/Outcome) are outlined in the Methods.

Similar articles

Cited by

References

    1. Chan M. World now at the start of 2009 influenza pandemic. 2009. Available: http://www.who.int/mediacentre/news/statements/2009/h1n1_pandemic_phase6.... Accessed 2009 Jul 26.
    1. National Advisory Committee on Immunization. Statement on influenza vaccination for the 2008–2009 season. An Advisory Committee Statement (ACS). Can Commun Dis Rep. 2008;34:1–46. - PubMed
    1. Nichol KL, Nordin JD, Nelson DB, Mullooly JP, Hak E. Effectiveness of influenza vaccine in the community-dwelling elderly. N Engl J Med. 2007;357:1373–1381. - PubMed
    1. Simonsen L, Taylor RJ, Viboud C, Miller MA, Jackson LA. Mortality benefits of influenza vaccination in elderly people: an ongoing controversy. Lancet Infect Dis. 2007;7:658–666. - PubMed
    1. Goodwin K, Viboud C, Simonsen L. Antibody response to influenza vaccination in the elderly: a quantitative review. Vaccine. 2006;24:1159–1169. - PubMed

Publication types

MeSH terms

Substances