. 2010 May 5;5(5):e10479.
doi: 10.1371/journal.pone.0010479.

Characterization of the Raf kinase inhibitory protein (RKIP) binding pocket: NMR-based screening identifies small-molecule ligands

Affiliations

Characterization of the Raf kinase inhibitory protein (RKIP) binding pocket: NMR-based screening identifies small-molecule ligands

Anne N Shemon et al. PLoS One. .

Abstract

Background: Raf kinase inhibitory protein (RKIP), also known as phoshaptidylethanolamine binding protein (PEBP), has been shown to inhibit Raf and thereby negatively regulate growth factor signaling by the Raf/MAP kinase pathway. RKIP has also been shown to suppress metastasis. We have previously demonstrated that RKIP/Raf interaction is regulated by two mechanisms: phosphorylation of RKIP at Ser-153, and occupation of RKIP's conserved ligand binding domain with a phospholipid (2-dihexanoyl-sn-glycero-3-phosphoethanolamine; DHPE). In addition to phospholipids, other ligands have been reported to bind this domain; however their binding properties remain uncharacterized.

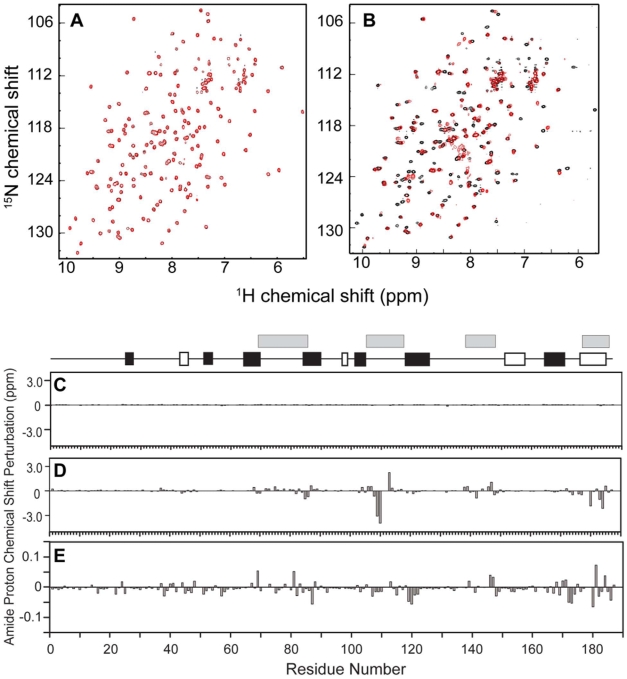
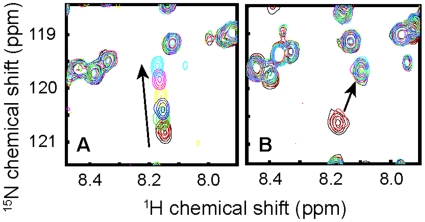
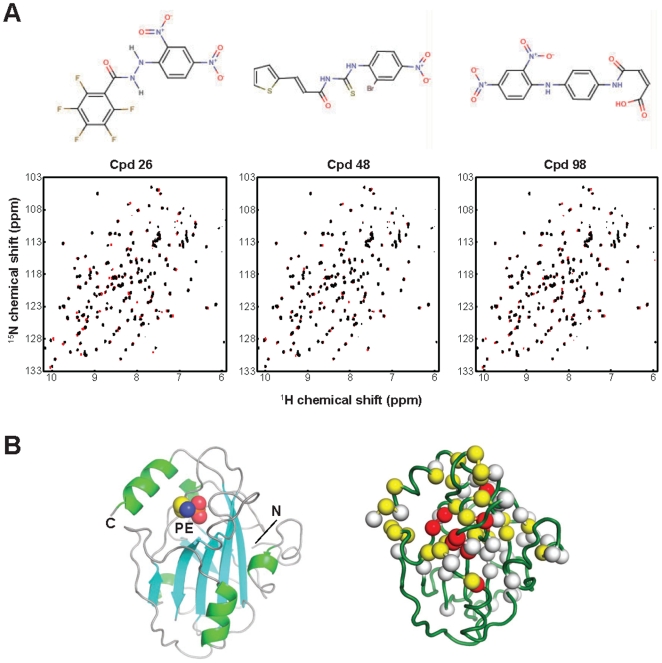
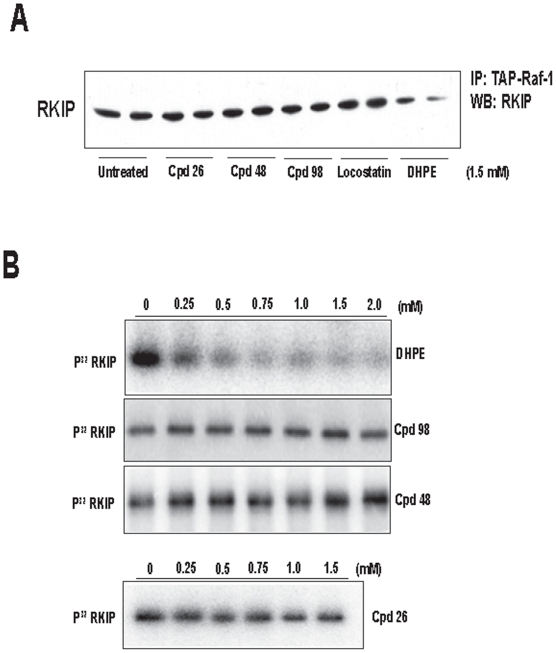
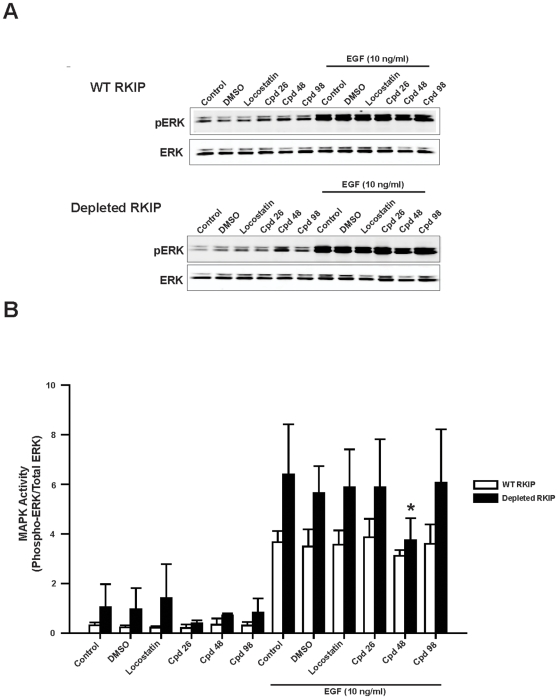
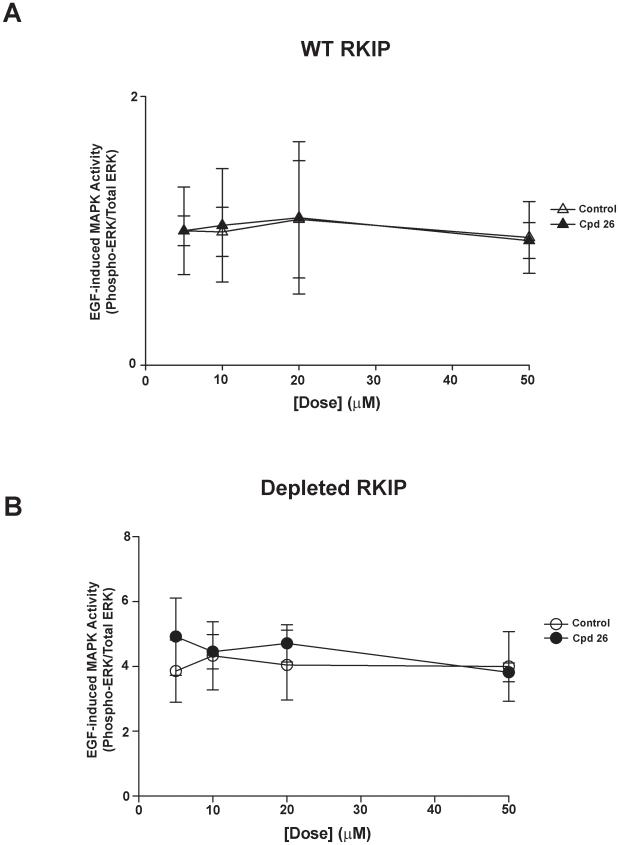
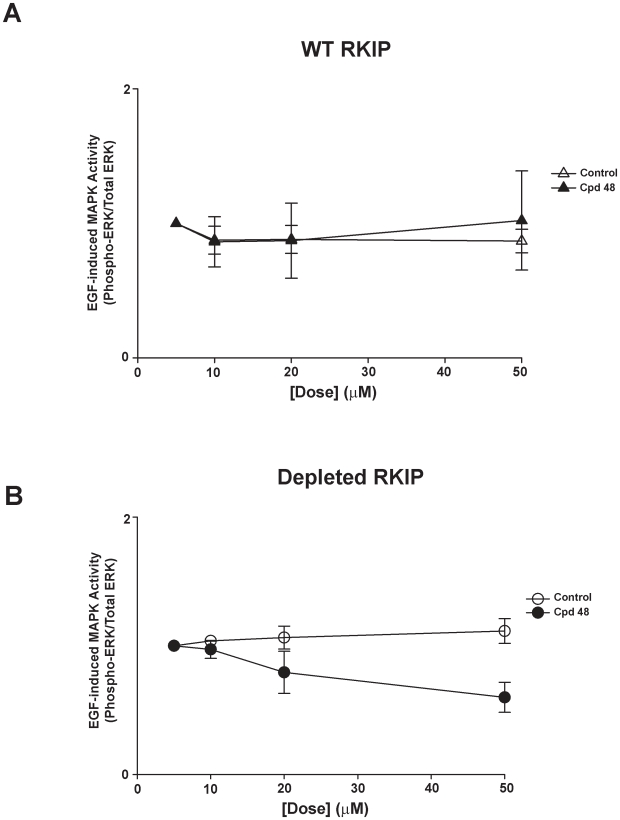
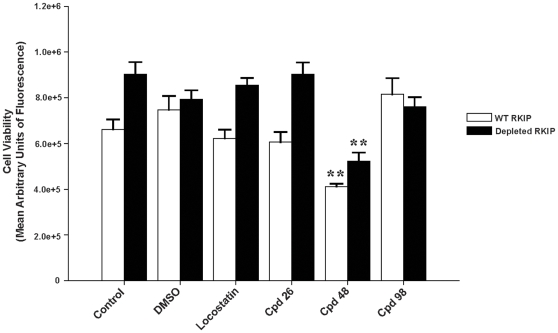
Methods/findings: In this study, we used high-resolution heteronuclear NMR spectroscopy to screen a chemical library and assay a number of potential RKIP ligands for binding to the protein. Surprisingly, many compounds previously postulated as RKIP ligands showed no detectable binding in near-physiological solution conditions even at millimolar concentrations. In contrast, we found three novel ligands for RKIP that specifically bind to the RKIP pocket. Interestingly, unlike the phospholipid, DHPE, these newly identified ligands did not affect RKIP binding to Raf-1 or RKIP phosphorylation. One out of the three ligands displayed off target biological effects, impairing EGF-induced MAPK and metabolic activity.

Conclusions/significance: This work defines the binding properties of RKIP ligands under near physiological conditions, establishing RKIP's affinity for hydrophobic ligands and the importance of bulky aliphatic chains for inhibiting its function. The common structural elements of these compounds defines a minimal requirement for RKIP binding and thus they can be used as lead compounds for future design of RKIP ligands with therapeutic potential.


Conflict of interest statement

Competing Interests: The authors have declared that no competing interests exist.

Figures

Figure 1
Figure 1. Overlay of 1H,15N-HSQC spectra of RKIP in the absence (black) and presence (red) of a potential ligand.
(A) PE (10 mM) does not result in any significant chemical shift perturbations. (B) 1H,15N-HSQC spectra of RKIP taken at pH 6.0 (red) and at pH 7.4 (black) showing a large number of missing peaks at pH 6.0. In all the panels, red contours are plotted over black contours, and thus a black cross peak appears only when its corresponding peak drawn in red is either shifted or missing. RKIP chemical shift perturbations for amide proton resonances by PE (10 mM) (C) or DHPE (4.5 mM) (D) at pH 7.4 plotted as a function of residue number. Secondary structural elements are depicted at the top with beta-sheet and alpha-helices represented by closed and open boxes, respectively. Gray boxes indicate the position of residues that form the ligand-binding pocket. (E) RKIP chemical shift perturbations by PE (100 mM) at pH 6.0. Note that panel E is plotted on a smaller vertical scale than that for C and D.
Figure 2
Figure 2. A portion of RKIP HSQC spectra illustrating the difference in the DHPA-induced chemical shift perturbations of residue 182 at pH 7.4 and 6.0.
(A) DHPA titration at pH 7.4 causes the peak to continuously shift, characteristic of fast exchange kinetics. (B) Titration at pH 6.0 causes the peak intensity to decrease with a concomitant appearance of a new peak, characteristic of slow exchange kinetics. The arrows indicate the trajectories of cross peak movements. Panel (A) shows data with DHPA concentrations of 0, 0.05 0.25, 0.5, 1.0, 2.5 and 7.5 mM, and (B) data with 0, 0.05, 0.25, 0.5, 1.0, 2.5 and 4.5 mM DHPA.
Figure 3
Figure 3. Newly identified RKIP ligands.
(A) The chemical structures of compounds 26, 48 and 98 and their effects on the RKIP HSQC NMR spectrum. The 1H,15N HSQC spectrum of RKIP taken in the presence of the indicated compound is plotted in red and a control spectrum in the absence of a compound in black. The black spectrum is plotted over the red one so that red cross peaks are visible only for those that are perturbed by the compound (B) A cartoon representation of the crystal structure of RKIP bound to PE (left; PDB id, 2IQX), and the locations of residues whose HSQC peaks were perturbed by compound 26. Red, yellow and white spheres indicate the Cα positions for residues whose peaks were shifted by more than two peak widths, 1 to 2 peak withs and less than one peak width, respectively. Because the three compounds perturbed very similar sets of residues, only data for compound 26 are shown.
Figure 4
Figure 4. DHPE but not compounds 98, 48, 26 nor locostatin decreases RKIP interactions with Raf-1 and PKC.
(A) Representative western blot of RKIP association with Raf-1 in the presence of 1.5 mM Compounds 26, 48 or 98 as well as locostatin or DHPE. (B) PKC phosphorylation of RKIP in the presence of increasing concentrations of DHPE or compounds 98, 48, or 26 (Representative autoradiogram is shown).
Figure 5
Figure 5. Compound 48 reduces EGF-induced MAPK activity.
HeLa cells expressing wild-type or depleted RKIP were serum starved overnight and then pre-treated for 30 min with 20 µM compounds (as indicated). EGF (10 ng/ml) was added in the final 5 minutes of incubation. (A) Whole cell lysates (30 µg) were separated on SDS-PAGE gels (12.5%), transferred to nitrocellulose and analysed by immunoblotting with anti-phospho ERK (Top panel: representative Western blot) and anti-total ERK antibodies (Bottom panel: representative Western blot). (B) ERK phosphorylation was assessed by normalizing phospho-ERK levels to total ERK levels as depicted in bar graphs (Mean ± SEM; n = 3 independent experiments). *p<0.05 indicates the significance of change relative to the DMSO control in the presence of EGF.
Figure 6
Figure 6. Increasing doses of compound 26 does not change EGF-induced MAPK activity.
HeLa cells expressing wild-type (A) or depleted RKIP (B) were serum starved overnight and then pre-treated for 30 min with increasing doses of DMSO (control) or Compound 26. EGF (10 ng/ml) was added in the final 5 minutes of incubation. Whole cell lysates (30 µg) were separated on SDS-PAGE gels (12.5%), transferred to nitrocellulose and analysed by immunoblotting with anti-phospho ERK and anti-total ERK antibodies. ERK phosphorylation was assessed by normalizing phospho-ERK levels to total ERK levels as depicted in line graphs. The results shown are mean ± range of two independent experiments.
Figure 7
Figure 7. Compound 48 reduces EGF-induced MAPK activity dose dependently.
HeLa cells (0.5×10⁶ cells/ml) expressing wild-type (A) or depleted RKIP (B) were serum starved overnight and then pre-treated for 30 min with increasing doses of DMSO (control) or compound 48. EGF (10 ng/ml) was added in the final 5 minutes of incubation. Whole cell lysates (30 µg) were separated on SDS-PAGE gels (12.5%), transferred to nitrocellulose and analysed by immunoblotting with anti-phospho ERK and anti-total ERK antibodies. ERK phosphorylation was assessed by normalizing phospho-ERK levels to total ERK levels as depicted in line graphs. The results shown are mean ± range of two independent experiments.
Figure 8
Figure 8. Compound 48 reduces cell viability in HeLa cells.
HeLa cells (4×10⁴ cells/ml) expressing wild-type (open bars) or depleted RKIP (solid bars) were serum starved overnight and then pre-treated for 30 min with 20 µM DMSO (control) or compound 48. Reaction was stopped by the addition of cell titer blue (20 µl) to each well and incubated for 2 h at 37°C. Metabolic activity was measured on a fluorometer (Fluorescence 560Ex/590Em) and the results are described as the mean arbitrary units of fluorescence of triplicate wells of two independent experiments. **p<0.01 indicates the significance of the change relative to the corresponding sample in the absence of compound 48.

Similar articles

Cited by

References

    1. Trakul N, Menard RE, Schade GR, Qian Z, Rosner MR. Raf Kinase Inhibitory Protein Regulates Raf-1 but Not B-Raf Kinase Activation. J Biol Chem. 2005;280:24931–24940. - PubMed
    1. Yeung K, Seitz T, Li S, Janosch P, McFerran B, et al. Suppression of Raf-1 kinase activity and MAP kinase signalling by RKIP. Nature. 1999;401:173–177. - PubMed
    1. Corbit KC, Trakul N, Eves EM, Diaz B, Marshall M, et al. Activation of Raf-1 Signaling by Protein Kinase C through a Mechanism Involving Raf Kinase Inhibitory Protein. J Biol Chem. 2003;278:13061–13068. - PubMed
    1. Lorenz K, Lohse MJ, Quitterer U. Protein kinase C switches the Raf kinase inhibitor from Raf-1 to GRK-2. Nature. 2003;426:574–579. - PubMed
    1. Keller ET, Fu Z, Yeung K, Brennan M. Raf kinase inhibitor protein: a prostate cancer metastasis suppressor gene. Cancer Lett. 2004;207:131–137. - PubMed

Publication types

MeSH terms