

Perceptual expertise with objects predicts another hallmark of face perception
- PMID: 20465319
- PMCID: PMC2904397
- DOI: 10.1167/10.4.15
Perceptual expertise with objects predicts another hallmark of face perception
Abstract
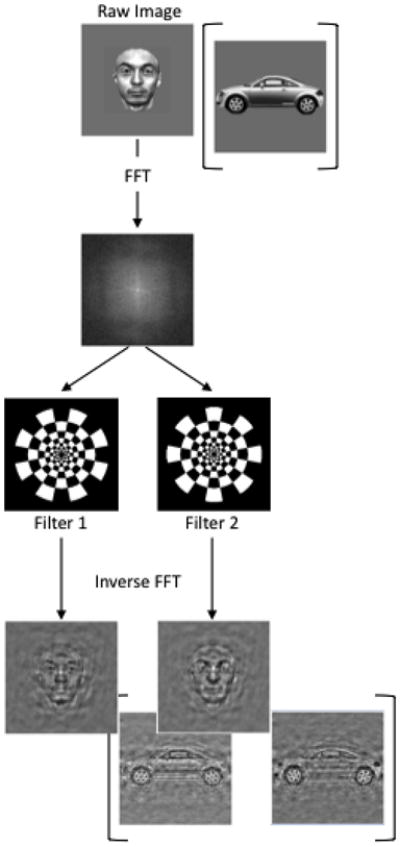
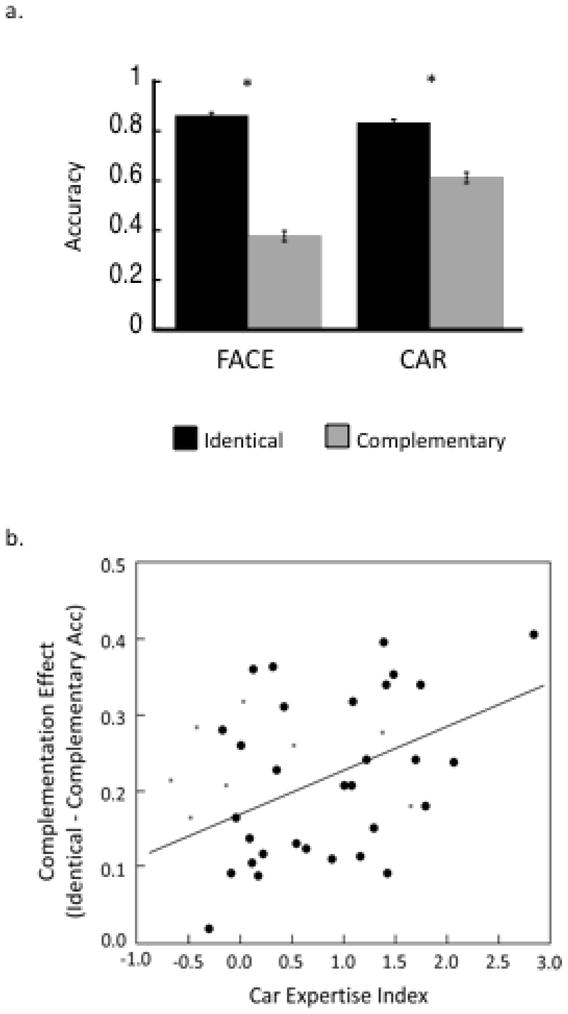
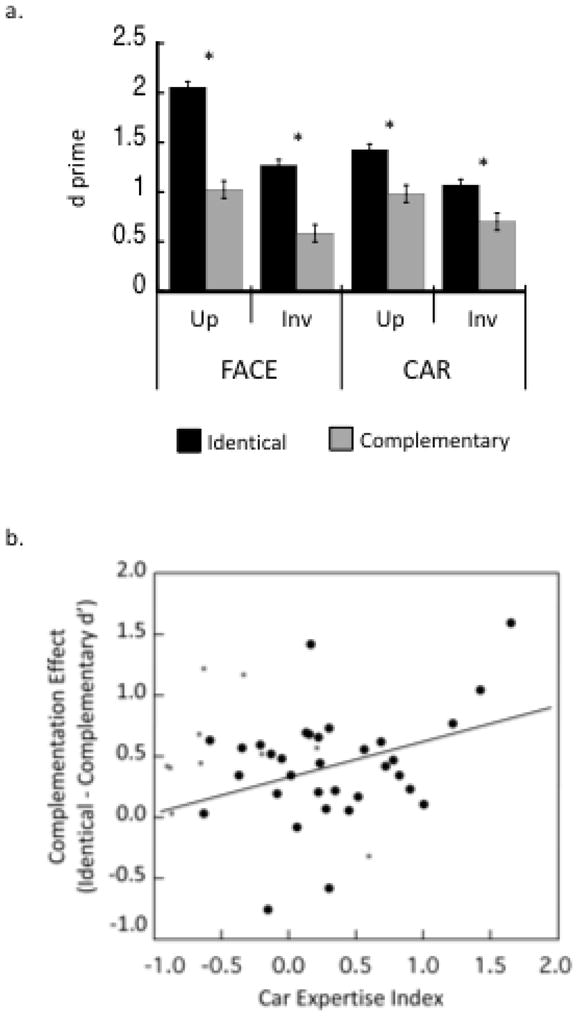
There is no shortage of evidence to suggest that faces constitute a special category in human perception. Surprisingly little consensus exists, however, regarding the interpretation of these results. The question persists: what makes faces special? We address this issue via one hallmark of face perception-its striking sensitivity to low-level image format-and present evidence in favor of an expertise account of the specialization of face perception. In accordance with earlier work (I. Biederman & P. Kalocsai, 1997), we find that manipulating one image into two versions that are complementary in spatial frequency (SF) and orientation information disproportionately impairs face matching relative to object matching. Here, we demonstrate that this characteristic of face processing is also found for cars, with its magnitude predicted by the observers' level of expertise with cars. We argue that the bar needs to be raised for what constitutes proper evidence that face perception is special in a manner that is not related to our expertise in this domain.
Figures
Similar articles
-
Sensitivity to spatial frequency and orientation content is not specific to face perception.Vision Res. 2009 Sep;49(19):2353-62. doi: 10.1016/j.visres.2009.06.019. Epub 2009 Jul 1. Vision Res. 2009. PMID: 19576237 Free PMC article.
-
The horizontal tuning of face perception relies on the processing of intermediate and high spatial frequencies.J Vis. 2011 Sep 7;11(10):1. doi: 10.1167/11.10.1. J Vis. 2011. PMID: 21900371
-
(In) sensitivity to spatial distortion in natural scenes.J Vis. 2010 Feb 24;10(2):23.1-15. doi: 10.1167/10.2.23. J Vis. 2010. PMID: 20462324 Free PMC article.
-
Neurocomputational bases of object and face recognition.Philos Trans R Soc Lond B Biol Sci. 1997 Aug 29;352(1358):1203-19. doi: 10.1098/rstb.1997.0103. Philos Trans R Soc Lond B Biol Sci. 1997. PMID: 9304687 Free PMC article. Review.
-
Can generic expertise explain special processing for faces?Trends Cogn Sci. 2007 Jan;11(1):8-15. doi: 10.1016/j.tics.2006.11.002. Epub 2006 Nov 28. Trends Cogn Sci. 2007. PMID: 17129746 Review.
Cited by
-
Haptic object perception: spatial dimensionality and relation to vision.Philos Trans R Soc Lond B Biol Sci. 2011 Nov 12;366(1581):3097-105. doi: 10.1098/rstb.2011.0153. Philos Trans R Soc Lond B Biol Sci. 2011. PMID: 21969691 Free PMC article. Review.
-
Irrelevant objects of expertise compete with faces during visual search.Atten Percept Psychophys. 2011 Feb;73(2):309-17. doi: 10.3758/s13414-010-0006-5. Atten Percept Psychophys. 2011. PMID: 21264705 Free PMC article.
-
The Neural Correlates of Developmental Prosopagnosia: Twenty-Five Years on.Brain Sci. 2023 Sep 30;13(10):1399. doi: 10.3390/brainsci13101399. Brain Sci. 2023. PMID: 37891769 Free PMC article. Review.
-
Modeling memory dynamics in visual expertise.J Exp Psychol Learn Mem Cogn. 2019 Sep;45(9):1599-1618. doi: 10.1037/xlm0000664. Epub 2018 Oct 22. J Exp Psychol Learn Mem Cogn. 2019. PMID: 30346211 Free PMC article.
-
Are all types of expertise created equal? Car experts use different spatial frequency scales for subordinate categorization of cars and faces.PLoS One. 2013 Jun 24;8(6):e67024. doi: 10.1371/journal.pone.0067024. Print 2013. PLoS One. 2013. PMID: 23826188 Free PMC article.
References
-
- Biederman I. Recognition by components: A theory of human image understanding. Psychological Review. 1987;94:115–147. - PubMed
-
- Biederman I, Ju G. Surface vs. edge-based determinants of visual recognition. Cognitive Psychology. 1988;20:38–64. - PubMed
-
- Bruce V, Doyle T, Dench N, Burton M. Remembering facial configurations. Cognition. 1991;38:109–144. - PubMed
-
- Bukach CM, Gauthier I, Tarr MJ. Beyond faces and modularity: the power of an expertise framework. Trends in Cognitive Science. 2006;10:159–166. - PubMed
Publication types
MeSH terms
Grants and funding
LinkOut - more resources
Full Text Sources
