. 2010 May 13:3:18.
doi: 10.1186/1755-8794-3-18.

Molecular analysis of endothelial progenitor cell (EPC) subtypes reveals two distinct cell populations with different identities

Affiliations

Molecular analysis of endothelial progenitor cell (EPC) subtypes reveals two distinct cell populations with different identities

Reinhold J Medina et al. BMC Med Genomics. .

Abstract

Background: The term endothelial progenitor cells (EPCs) is currently used to refer to cell populations which are quite dissimilar in terms of biological properties. This study provides a detailed molecular fingerprint for two EPC subtypes: early EPCs (eEPCs) and outgrowth endothelial cells (OECs).

Methods: Human blood-derived eEPCs and OECs were characterised by using genome-wide transcriptional profiling, 2D protein electrophoresis, and electron microscopy. Comparative analysis at the transcript and protein level included monocytes and mature endothelial cells as reference cell types.

Results: Our data show that eEPCs and OECs have strikingly different gene expression signatures. Many highly expressed transcripts in eEPCs are haematopoietic specific (RUNX1, WAS, LYN) with links to immunity and inflammation (TLRs, CD14, HLAs), whereas many transcripts involved in vascular development and angiogenesis-related signalling pathways (Tie2, eNOS, Ephrins) are highly expressed in OECs. Comparative analysis with monocytes and mature endothelial cells clusters eEPCs with monocytes, while OECs segment with endothelial cells. Similarly, proteomic analysis revealed that 90% of spots identified by 2-D gel analysis are common between OECs and endothelial cells while eEPCs share 77% with monocytes. In line with the expression pattern of caveolins and cadherins identified by microarray analysis, ultrastructural evaluation highlighted the presence of caveolae and adherens junctions only in OECs.

Conclusions: This study provides evidence that eEPCs are haematopoietic cells with a molecular phenotype linked to monocytes; whereas OECs exhibit commitment to the endothelial lineage. These findings indicate that OECs might be an attractive cell candidate for inducing therapeutic angiogenesis, while eEPC should be used with caution because of their monocytic nature.


Figures

Figure 1
Figure 1
Peripheral blood-derived eEPC and OECs have distinctive transcriptomes. Normalised data from Illumina WG-6 v3.0 Expression Beadchip were imported into NIA array for analysis. Numbers of upregulated transcripts are shown in red and downregulated transcripts in green. There were minimal differences (<50 transcripts) among technical replicates as shown by the log-ratio chart for pairwise comparison of eEPC replicates(A), and the log-ratio chart for pairwise comparison of OEC replicates(B); however there were extensive differences (> 5000 differentially expressed transcripts) when eEPCs were compared to OECs as shown by the log-ratio chart for pairwise comparison of eEPCs vs. OECs(C). Prinicipal component analysis (PCA) segregates eEPCs from OECs(D) using one single component (PC1). Biplot analysis on PCA graph identifies transcripts specifically expressed in each EPC subtype(E).
Figure 2
Figure 2
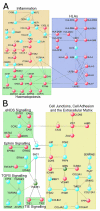
Transcriptome-based interactome analysis reveals that eEPCs express haematopoietic transcripts and OECs express endothelial transcripts. Differentially expressed transcripts were imported into visANT software to create gene networks. Diagrams show nodes representing genes, lines indicate interactions between proteins, and boxes denote functional categories. (A) eEPC interactome network, nodes in red are primarily haematopoietic. (B) OEC interactome network, nodes in red are highly expressed in endothelial cells.
Figure 3
Figure 3
Expression of characteristic eEPC and OEC genes determined by RT-PCR. (A) Expression of mRNAs distinctive for eEPCs and OECs determined by semiquantitative PCR: eEPC highly expressed genes HLA-DRA, LYZ, and CD14; OECs highly expressed genes CAV1, VE-CAD, and VWF. (B) Quantitative real time PCR showing gene expression fold changes for the eEPC genes. (C) Quantitative real time PCR showing gene expression fold changes for the OEC genes. Error bars in B and C show mean ± SEM of three biological replicates for each EPC subtype.
Figure 4
Figure 4
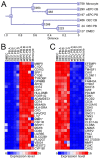
EPC gene signature relates to monocytes, while OECs are closely linked to endothelial cells. (A) Hierarchical clustering reveals two major branches: eEPCs are clustered together with monocytes, whilst OECs are grouped with DMECs. Distance represents the similarity of gene expression between different samples (the closer the more similar), and numbers in black indicate statistically significant number of transcripts that identify a cluster; numbers in blue are transcript cluster IDs: clusters 1-6 indicate specific transcripts for a cell type; clusters 7-10 indicate common transcripts for 2/3 cell types; and cluster 11 indicates transcripts present equally in all samples. (B) Heat map of top 30 highly expressed genes in eEPCs demonstrating that eEPCs share a similar gene signature with monocytes. (C) Heat map of top 30 highly expressed genes in OECs indicates a high degree of correlation between OECs and DMECs.
Figure 5
Figure 5
Comparative proteome analysis of human DMECs, OECs, eEPCs, and monocytes. (A) Representative images of 2D gels showing protein spots distributed according to their molecular weight vertically; and isoelectric point horizontally from 4 to 7, right to left, respectively. (B) Comparative assessment by overlaying 2D gel images and matching spots. Common spots appear in green colour. Numbers in the bottom right corner show percentage of the progenitor cell proteome that matches the comparator cell type proteome. (C) Venn diagram indicating high overlap between DMECs and OECs proteomes. (D) Venn diagram showing quantification of similar spots between eEPCs and monocytes.
Figure 6
Figure 6
Ultrastructure analysis identifies typical endothelial features in OECs. Representative images of eEPCs (A) and OECs (B) by transmission electron microscopy. White arrows indicate lysosome-like structures. Ultrastructural features recognized as adherens junctions indicated by black arrowheads (C), and abundant caveolae (D) in the plasma membrane were only present in OECs. Caveolae display two distinct morphologies, single pits (D) and clusters (E).

References

    1. Fadini GP, Baesso I, Albiero M, Sartore S, Agostini C, Avogaro A. Technical notes on endothelial progenitor cells: ways to escape from the knowledge plateau. Atherosclerosis. 2008;197(2):496–503. doi: 10.1016/j.atherosclerosis.2007.12.039. - DOI - PubMed
    1. Rafii S, Lyden D. Therapeutic stem and progenitor cell transplantation for organ vascularization and regeneration. Nat Med. 2003;9(6):702–712. doi: 10.1038/nm0603-702. - DOI - PubMed
    1. Ward MR, Stewart DJ, Kutryk MJ. Endothelial progenitor cell therapy for the treatment of coronary disease, acute MI, and pulmonary arterial hypertension: current perspectives. Catheter Cardiovasc Interv. 2007;70(7):983–998. doi: 10.1002/ccd.21302. - DOI - PubMed
    1. Sekiguchi H, Ii M, Losordo DW. The relative potency and safety of endothelial progenitor cells and unselected mononuclear cells for recovery from myocardial infarction and ischemia. J Cell Physiol. 2009;219(2):235–242. doi: 10.1002/jcp.21672. - DOI - PubMed
    1. Tateishi-Yuyama E, Matsubara H, Murohara T, Ikeda U, Shintani S, Masaki H, Amano K, Kishimoto Y, Yoshimoto K, Akashi H. Therapeutic angiogenesis for patients with limb ischaemia by autologous transplantation of bone-marrow cells: a pilot study and a randomised controlled trial. Lancet. 2002;360(9331):427–435. doi: 10.1016/S0140-6736(02)09670-8. - DOI - PubMed

Publication types