. 2010 May 13:4:61.
doi: 10.1186/1752-0509-4-61.

Metabolic effects of influenza virus infection in cultured animal cells: Intra- and extracellular metabolite profiling

Affiliations

Metabolic effects of influenza virus infection in cultured animal cells: Intra- and extracellular metabolite profiling

Joachim B Ritter et al. BMC Syst Biol. .

Abstract

Background: Many details in cell culture-derived influenza vaccine production are still poorly understood and approaches for process optimization mainly remain empirical. More insights on mammalian cell metabolism after a viral infection could give hints on limitations and cell-specific virus production capacities. A detailed metabolic characterization of an influenza infected adherent cell line (MDCK) was carried out based on extracellular and intracellular measurements of metabolite concentrations.

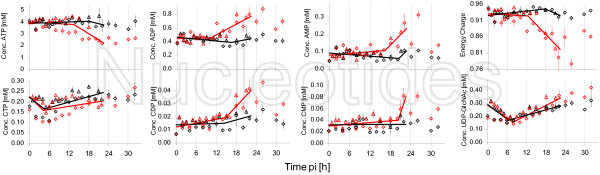
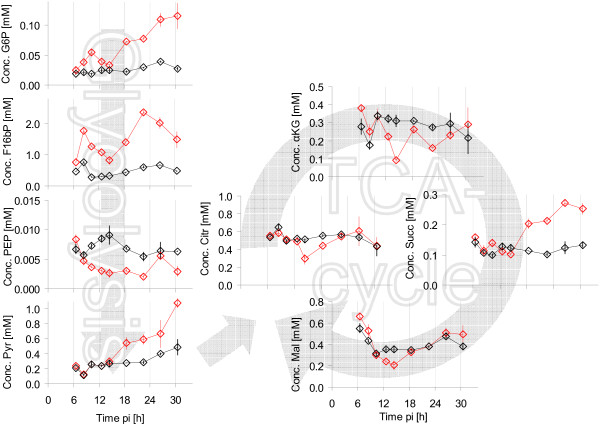
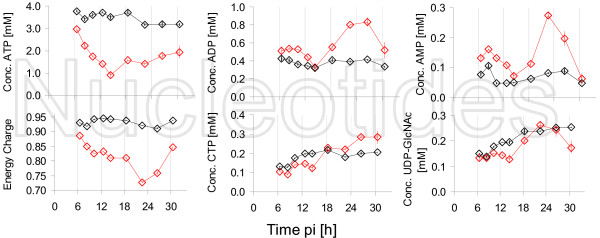
Results: For most metabolites the comparison of infected (human influenza A/PR/8/34) and mock-infected cells showed a very similar behavior during the first 10-12 h post infection (pi). Significant changes were observed after about 12 h pi: (1) uptake of extracellular glucose and lactate release into the cell culture supernatant were clearly increased in infected cells compared to mock-infected cells. At the same time (12 h pi) intracellular metabolite concentrations of the upper part of glycolysis were significantly increased. On the contrary, nucleoside triphosphate concentrations of infected cells dropped clearly after 12 h pi. This behaviour was observed for two different human influenza A/PR/8/34 strains at slightly different time points.

Conclusions: Comparing these results with literature values for the time course of infection with same influenza strains, underline the hypothesis that influenza infection only represents a minor additional burden for host cell metabolism. The metabolic changes observed after 12 h pi are most probably caused by the onset of apoptosis in infected cells. The comparison of experimental data from two variants of the A/PR/8/34 virus strain (RKI versus NIBSC) with different productivities and infection dynamics showed comparable metabolic patterns but a clearly different timely behavior. Thus, infection dynamics are obviously reflected in host cell metabolism.


Figures

Figure 1
Figure 1
Cell density and virus titers of MDCK cells after influenza resp. mock infection. Three different experiments have been performed in six-well plates. The cells were infected with RKI (A) resp. mock-infected (B). Virus titers of infected cells of two experiments are shown in (C). Symbols represent average cell number from determination of three wells (Exp 1 △; Exp 2: ◇; Exp 3: □). Full symbols represent adherent cells, empty symbols represent detached (suspension) cells. Solid, thick lines indicate estimated cell numbers for adherent cells based on the mathematical model. Dashed thick lines represent the respective estimation for suspension cells. For (C): Symbols represent the average log HA value of three different wells. The thick line indicates the estimated HA-value according to the model. Data from HA measurements from the experiments RKI 2 and RKI 3. The fit for HA was only performed for RKI 2 (HA measurements from RKI 2 and 3 were combined).
Figure 2
Figure 2
Concentrations of extracellular metabolites for MDCK cells after infection with influenza virus. Measurements from infections with the RKI variant are shown in the first row, mock-infection in the second row. Symbols represent average concentration from determination of three wells (Exp 1 △; Exp 2: ◇; Exp 3: □). (A) & (B): glucose (full symbol, solid lines) and lactate (empty symbol, dashed lines), three experiments; (C) & (D): glutamine (full symbol, solid lines) and ammonia (empty symbol, dashed lines), two experiments; (E) & (F): glutamate, two experiments. Thick lines indicate the estimation of the concentration based on the mathematical model.
Figure 3
Figure 3
Concentrations of selected extracellular amino acids for MDCK cells after infection with influenza virus. Symbols represent average concentrations from three wells of the experiment with the RKI variant (red) and mock-infection (black) for Exp 1. Error bars represent the standard error of the mean.
Figure 4
Figure 4
Intracellular metabolite concentrations after infection. Symbols represent average concentrations of three wells of one six-well plate, the error bars the respective standard error of the mean. Two different experiments were performed under identical conditions (Exp 1 △; Exp 2: ◇). Solid lines indicate linear spline interpolations for two phases performed with combined data from both experiments for data points up to 22 h pi.
Figure 5
Figure 5
Intracellular concentrations of nucleotides and energy charge after infection. Symbols represent the average concentrations of three wells after infection with RKI (red) resp. mock-infection (black). Two different experiments were performed under identical conditions(Exp 1 △; Exp 2: ◇). Solid lines indicate linear spline interpolations for two phases performed with combined data from both experiments for data points up to 22 h pi.
Figure 6
Figure 6
Histogram of time points for the metabolic switch for quantified intracellular metabolites. In total, 29 metabolites are summarized and grouped according to metabolite class. Glycolytic metabolites & R5P are blue; intermediates from TCA-cycle are red; nucleotides are black. Binning was set to 1 h.
Figure 7
Figure 7
Adherent and suspension cell density after infections with influenza variant from NIBSC. Two different experiments where performed with NIBSC variant (red symbols and lines, Exp 2: ◇; Exp 3: □) and mock-infection (black symbols and lines) for Exp 2 in six-well plates (A). Virus titers of infected cells (B). For further explanation it is referred to Figure 1. Additionally, blue lines indicate the estimates of the respective variables for the RKI variant (see also Figure 1).
Figure 8
Figure 8
Concentrations of extracellular metabolites after infection with influenza virus from NIBSC. MDCK cells were infected with NIBSC virus (red symbols and lines) or mock-infection (black symbols and lines). Symbols represent average concentrations from determination of three wells. (A): Glucose (full symbol, solid lines) and lactate (empty symbol, dashed lines), two experiments (infection: Exp 2: ◇; Exp 3: □; mock-infection: Exp 2); (B): glutamate (Exp 2). Thick lines indicate the estimation of concentration based on the mathematical model.
Figure 9
Figure 9
Intracellular concentrations of metabolites. Time course of intracellular metabolites from glycolysis, TCA-cycle after infection with influenza virus from NIBSC (red) and mock-infection (black) for Exp 2. Symbols represent average concentrations of three wells of one six-well plate and error bars the respective standard error of the mean.
Figure 10
Figure 10
Intracellular concentrations of selected nucleotides and energy charge after infection with influenza virus from NIBSC. Infection was performed with NIBSC (red) and mock-infection (black). Symbols represent average of three wells of one six-well plate and error bars the respective standard error of the mean.
Figure 11
Figure 11
Scheme of the experimental steps. (1) MDCK cells are cultivated in 4 mL cell growth medium (GMEM with serum) for four days. (2) The confluent cell layer is washed and virus maintenance medium (VMM) is added, in case of infection with active virus particles. (3) Samples are taken from two six-well plates to monitor intracellular and extracellular concentrations.

References

    1. Nicholson KG, Webster RG, Hay AJ. Textbook of influenza. Oxford: Blackwell Science; 1998.
    1. Audsley JM, Tannock GA. Cell-based influenza vaccines: progress to date. Drugs. 2008;68:1483–1491. doi: 10.2165/00003495-200868110-00002. - DOI - PubMed
    1. Kemble G, Greenberg H. Novel generations of influenza vaccines. Vaccine. 2003;21:1789–1795. doi: 10.1016/S0264-410X(03)00074-4. - DOI - PubMed
    1. Genzel Y, Schulze-Horsel J, Mohler L, Sidorenko Y, Reichl U. Influenza vaccines - Challenges in mammalian cell culture technology. Cell Technol Cell Prod. 2007. pp. 503–508. full_text.
    1. Lowy RJ. Influenza virus induction of apoptosis by intrinsic and extrinsic mechanisms. Int Rev Immunol. 2003;22:425–449. doi: 10.1080/08830180305216. - DOI - PubMed

Publication types