. 2010 May 13;2(5):33.
doi: 10.1186/gm154.

Staging of biliary atresia at diagnosis by molecular profiling of the liver

Affiliations

Staging of biliary atresia at diagnosis by molecular profiling of the liver

Katie Moyer et al. Genome Med. .

Abstract

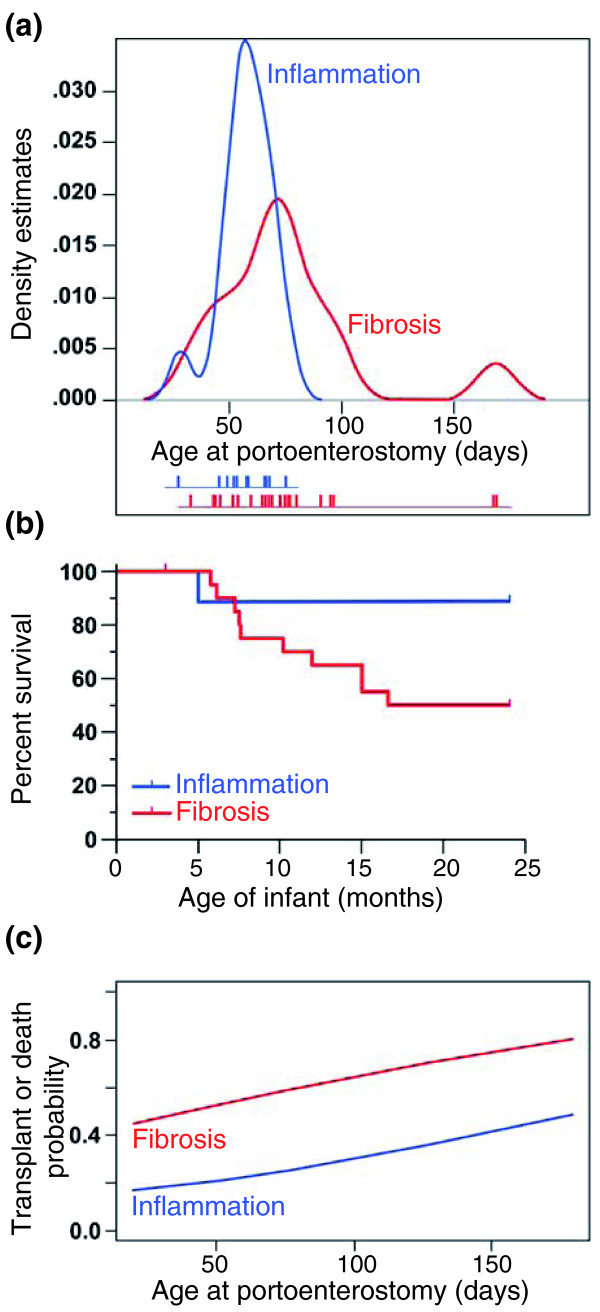
Background: Young age at portoenterostomy has been linked to improved outcome in biliary atresia, but pre-existing biological factors may influence the rate of disease progression. In this study, we aimed to determine whether molecular profiling of the liver identifies stages of disease at diagnosis.

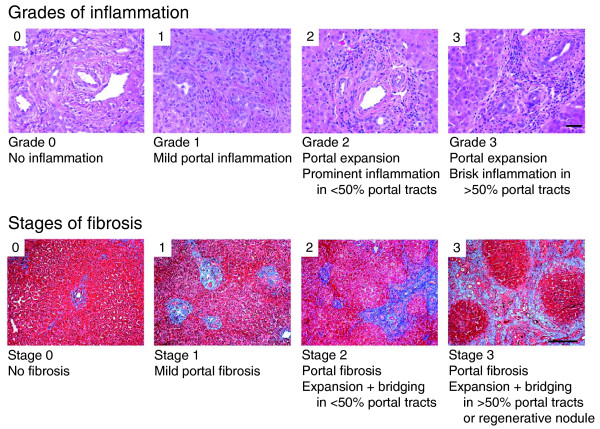
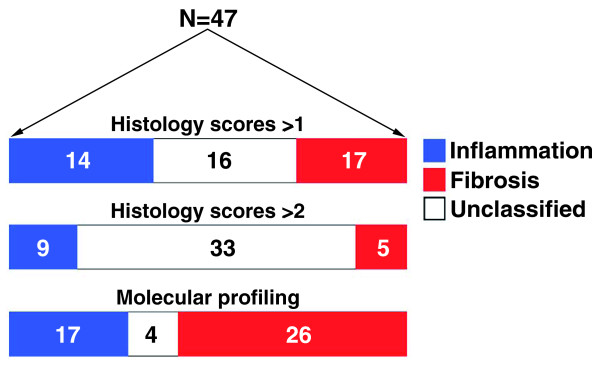
Methods: We examined liver biopsies from 47 infants with biliary atresia enrolled in a prospective observational study. Biopsies were scored for inflammation and fibrosis, used for gene expression profiles, and tested for association with indicators of disease severity, response to surgery, and survival at 2 years.

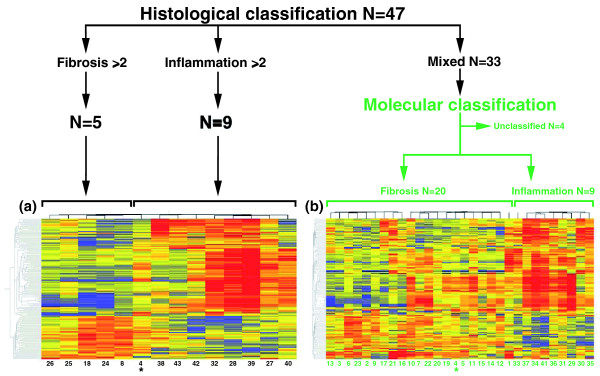
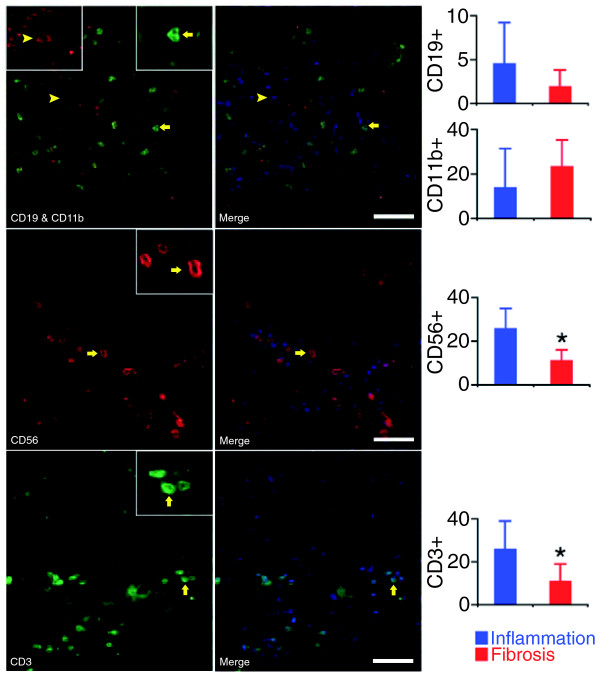
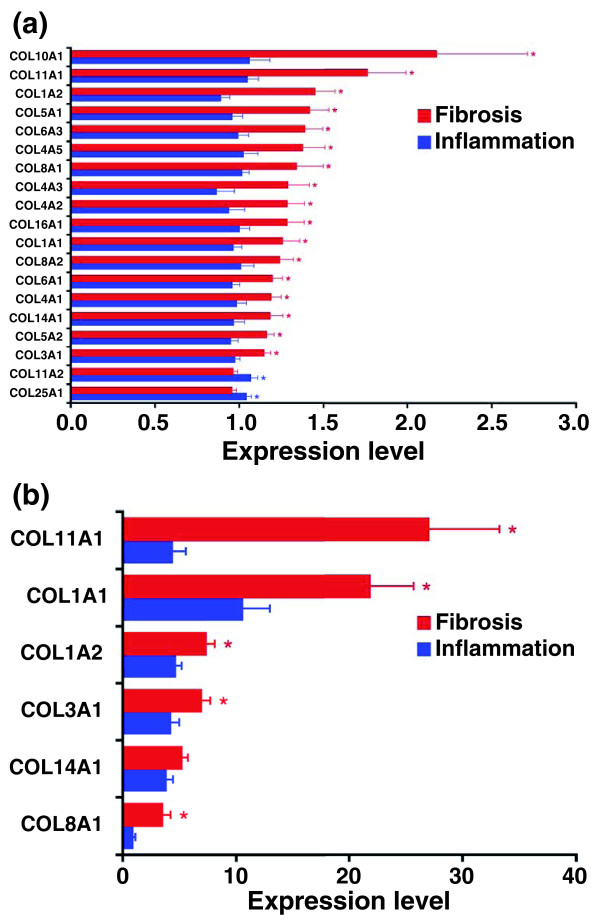
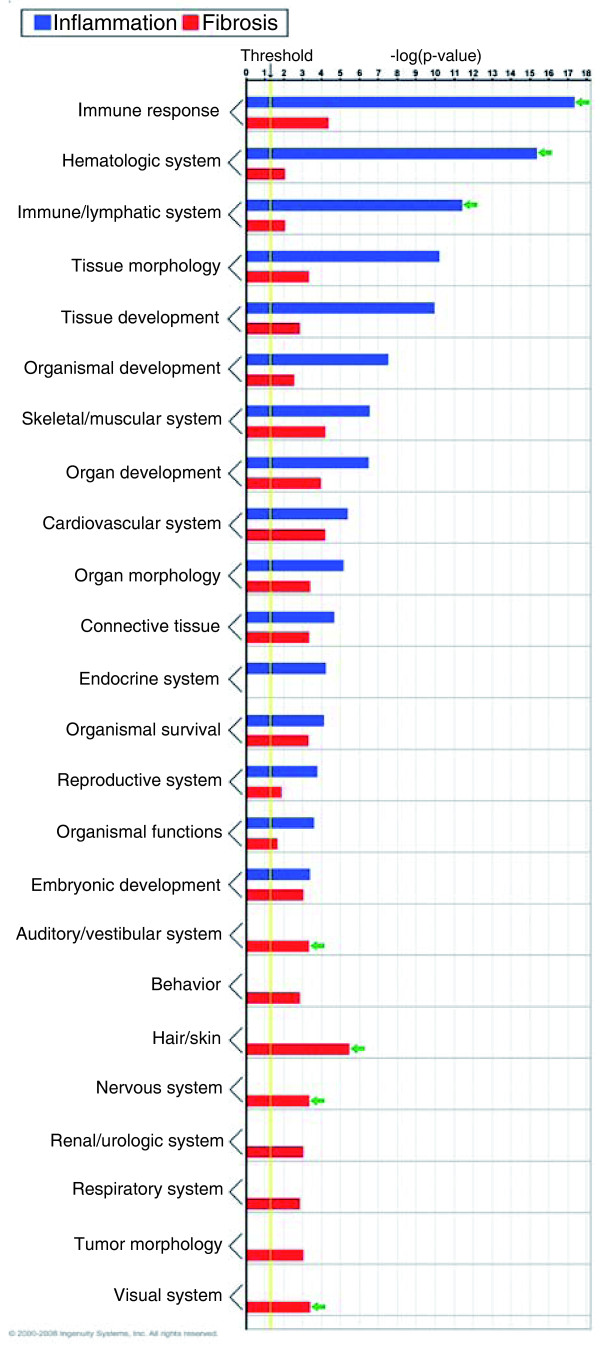
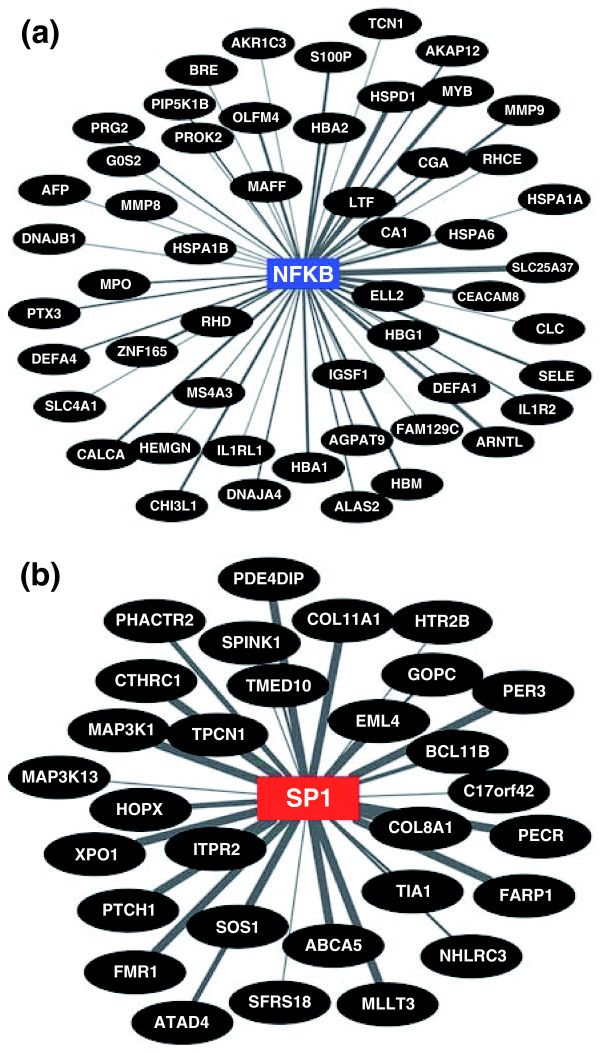
Results: Fourteen of 47 livers displayed predominant histological features of inflammation (N = 9) or fibrosis (N = 5), with the remainder showing similar levels of both simultaneously. By differential profiling of gene expression, the 14 livers had a unique molecular signature containing 150 gene probes. Applying prediction analysis models, the probes classified 29 of the remaining 33 livers into inflammation or fibrosis. Molecular classification into the two groups was validated by the findings of increased hepatic population of lymphocyte subsets or tissue accumulation of matrix substrates. The groups had no association with traditional markers of liver injury or function, response to surgery, or complications of cirrhosis. However, infants with an inflammation signature were younger, while those with a fibrosis signature had decreased transplant-free survival.

Conclusions: Molecular profiling at diagnosis of biliary atresia uncovers a signature of inflammation or fibrosis in most livers. This signature may relate to staging of disease at diagnosis and has implications to clinical outcomes.


Figures

Figure 1
Figure 1
Representative photographs of portal tracts stained with hematoxylin/eosin (upper panel) used for grading of liver sections in biliary atresia based on the presence of inflammatory cells (scale bar on photo 3 = 50 μm). The lower panels depict liver sections stained with trichrome for staging based on the extent of fibrosis (scale bar on photo 3 = 250 μm).
Figure 2
Figure 2
Assignment of infants with biliary atresia into groups of inflammation or fibrosis at diagnosis. When the differences in histological scores were ≥2, 5 of 47 livers had advanced fibrosis and 9 had predominant portal inflammation (black lines). These 14 livers displayed 150 gene probes that were differentially expressed between the fibrosis and inflammation groups (P < 0.05; Welch's t-test and 5% FDR - depicted as cluster analysis in (a)). Applying this expression signature to the 33 subjects classified histologically as 'mixed' (or unclassified), PAM assigned 29 subjects into groups of fibrosis or inflammation (N = 20 and N = 9, respectively) (b). The cluster analyses depict gene expression as a color variation from red (high expression) to blue (low expression); yellow displays similar level between the groups. The numbers below the columns denote individual patients (listed in Additional file 3). *Patient 4 is included in both cluster analyses because PAM reclassified the liver into the fibrosis group.
Figure 3
Figure 3
Quantification of hepatic mononuclear cells in portal tracts. Immunofluorescence panels (left) identify the population of portal tracts by B lymphocytes (CD19), myeloid cells (neutrophils and macrophages: CD11b), NK cells (CD56), and T cells (CD3) in livers with a molecular signature of inflammation. Photos on the right depict the left photos after nuclear staining with DAPI (white bar = 50 μm). The graphs on the right show the average number (± standard deviation) of stained cells in portal tracts from six livers with the inflammation signature and from five with the fibrosis signature. *P < 0.05.
Figure 4
Figure 4
Hepatic mRNA expression for collagen genes. (a) Hepatic mRNA expression for collagen genes in subjects comprising the inflammation (N = 17) or fibrosis (N = 26) groups by microarrays. (b) mRNA expression by real-time PCR is shown for a subset of collagen genes shown in (a). Results are shown as mean ± standard error for individual genes as a ratio to GAPDH; *P < 0.05 (P-values range from 0.048 to 3.6 × 10⁻⁷ in (a).
Figure 5
Figure 5
Functional grouping of genes that are up-regulated in inflammation (N = 77 genes) or fibrosis (N = 38 genes) groups using Ingenuity Pathways Analysis. Enrichment scores are represented as -log(P-value), with a threshold of 1.3 as the cut-off for significance (P < 0.05). Green arrows point to predominantly involved processes.
Figure 6
Figure 6
Functional relatedness of genes overexpressed in subjects with (a) the inflammation signature with NFkB or (b) the fibrosis signature with SP1 based on the number of TFBSs. The connecting line thickness is directly proportional to the number of TFBSs in the respective promoter regions. See Additional file 6 for the list of TFBSs for NFkB and SP1.
Figure 7
Figure 7
Relationship between molecular groups and clinical features. (a) The probability density function of age at the time of surgery (Kasai procedure) in relation to molecular signatures of inflammation or fibrosis in biliary atresia. The age of individual patients is shown below the graph as short vertical bars. (b) Kaplan-Meier analysis shows a decreased survival with the native liver in infants with the fibrosis signature (P = 0.04). (c) Logistic regression modeling depicts the effect of age on the association between molecular groups and the probability of transplant or death by 2 years of age (P = 0.079).
Figure 8
Figure 8
Classification of 47 infants with biliary atresia into groups of inflammation or fibrosis based on differential histological scores ≥1 or ≥2 or on molecular profiling at diagnosis.

References

    1. Balistreri WF, Grand R, Hoofnagle JH, Suchy FJ, Ryckman FC, Perlmutter DH, Sokol RJ. Biliary atresia: current concepts and research directions. Summary of a symposium. Hepatology. 1996;23:1682–1692. doi: 10.1002/hep.510230652. - DOI - PubMed
    1. Mack CL. The pathogenesis of biliary atresia: evidence for a virus-induced autoimmune disease. Semin Liver Dis. 2007;27:233–242. doi: 10.1055/s-2007-985068. - DOI - PMC - PubMed
    1. Bezerra JA, Tiao G, Ryckman FC, Alonso M, Sabla GE, Shneider B, Sokol RJ, Aronow BJ. Genetic induction of proinflammatory immunity in children with biliary atresia. Lancet. 2002;360:1653–1659. doi: 10.1016/S0140-6736(02)11603-5. - DOI - PubMed
    1. Mack CL, Falta MT, Sullivan AK, Karrer F, Sokol RJ, Freed B, Fontenot AP. Oligoclonal expansions of CD4+ and CD8+ T-cells in the target organ of patients with biliary atresia. Gastroenterology. 2007;133:278–287. doi: 10.1053/j.gastro.2007.04.032. - DOI - PMC - PubMed
    1. Mack CL, Tucker RM, Sokol RJ, Karrer FM, Kotzin BL, Whitington PF, Miller SD. Biliary atresia is associated with CD4+ Th1 cell-mediated portal tract inflammation. Pediatr Res. 2004;56:79–87. doi: 10.1203/01.PDR.0000130480.51066.FB. - DOI - PMC - PubMed