. 2010 Aug 25;169(2):882-92.
doi: 10.1016/j.neuroscience.2010.05.010. Epub 2010 May 11.

Activation of alpha1 and alpha2 noradrenergic receptors exert opposing effects on excitability of main olfactory bulb granule cells

Affiliations

Activation of alpha1 and alpha2 noradrenergic receptors exert opposing effects on excitability of main olfactory bulb granule cells

Q Nai et al. Neuroscience. .

Abstract

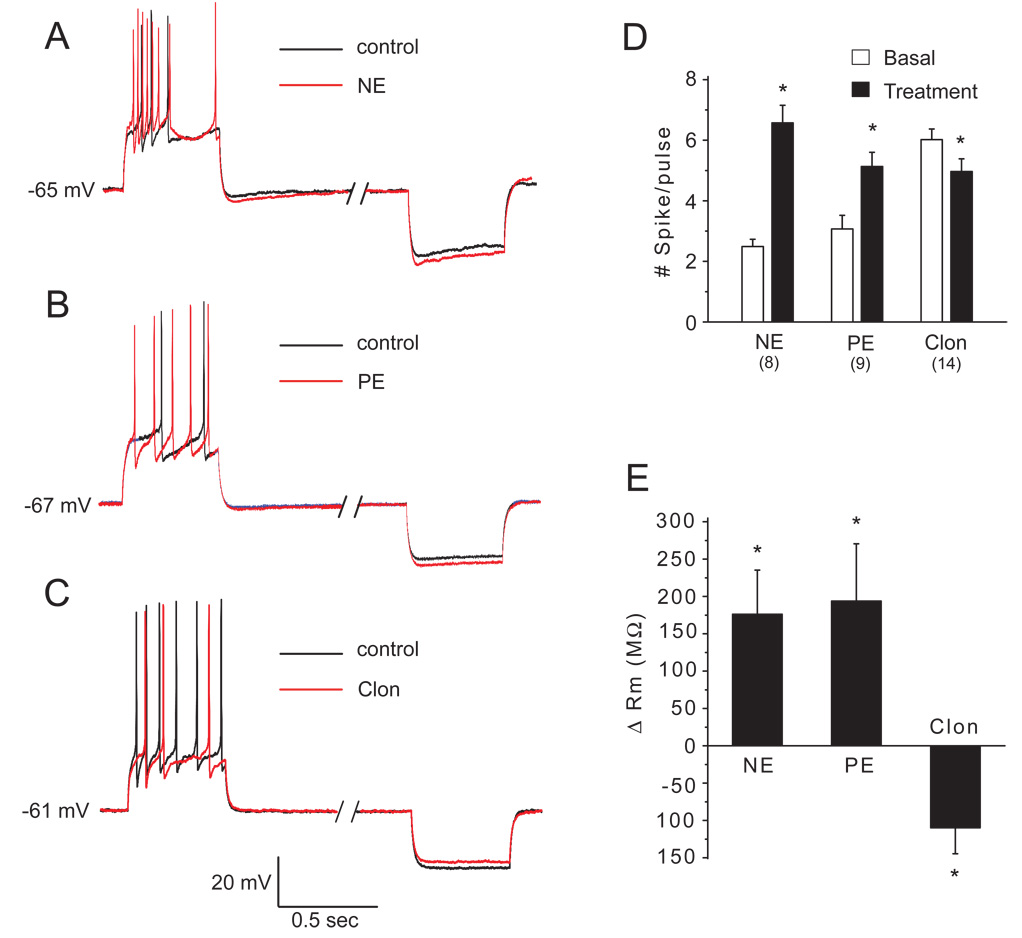
The mammalian main olfactory bulb (MOB) receives a dense noradrenergic innervation from the pontine nucleus locus coeruleus that is important for neonatal odor preference learning and odor processing in mature animals. Modulation of GABAergic granule cells (GCs) is thought to play a key role in the net functional impact of norepinephrine (NE) release in the MOB, yet there are few direct studies of the influence of NE on these cells. In the present study we investigated noradrenergic modulation of GC excitability using electrophysiological approaches in rat MOB slices. A moderate concentration of NE (10 microM) and the alpha1 receptor agonist phenylephrine (10 microM) depolarized and increased spontaneous or current injection-evoked spiking in GCs. By contrast, low NE concentrations (0.1-1.0 microM) or the alpha2 receptor agonist clonidine (Clon, 10 microM) hyperpolarized and decreased the discharge of GCs. The effects of NE (10 microM) were blocked by antagonism of alpha1 and alpha2 receptors. Inhibitory effects of low NE concentrations were blocked or converted to excitatory responses by alpha2 receptor blockade, whereas excitatory effects of the moderate NE concentration were converted to inhibitory responses after alpha1 receptor blockade. NE (10 microM) and phenylephrine elicited inward currents that reversed near the potassium equilibrium potential. The effects of NE and phenylephrine were associated with increased membrane input resistance. Clonidine elicited an outward current associated with decreased membrane input resistance that reversed near the potassium equilibrium potential. These results indicate that alpha1 and alpha2 receptor activation exert opposing effects on GC excitability. Low concentrations of NE acting via alpha2 receptors suppress GC excitability, while higher concentrations of NE acting at alpha1 receptors increase GC excitability. These findings are consistent with recent findings that alpha1 and alpha2 receptor activation increase and decrease, respectively, GABAergic inhibition of mitral cells. The differential affinities of alpha1 and alpha2 noradrenergic receptor subtypes may allow for differential modulation of GABA release and olfactory processing as a function of the level of NE release, which in turn, is regulated by behavioral state.


Figures

Figure 1
Figure 1
Effects of NE and α1 and α2 receptor agonists on GC membrane potential and discharge. A: A superficial GC filled with biocytin. GL, glomerular layer; EPL, external plexiform layer; MCL, mitral cell layer; GCL, GC layer; scale bar: 20 µm. B–D: Current clamp recordings in normal ACSF showing that NE (10 µM, B) or PE (10 µM, C) depolarized and increased the firing rate of GCs, while Clon (10 µM, D) hyperpolarized and decreased spontaneous discharge. E: Group data showing the effects of NE, PE and Clon on firing frequency (black bars) and membrane potential (unfilled bars); hatched bars show peak changes (see text). Data are expressed as increase or decrease in firing frequency or membrane potential from control (0). F–H: Bath application of CNQX (10 µM), APV (50 µM), and gabazine (10 µM) reduced baseline activity and spontaneous discharge in GCs. Under these conditions, 10 µM NE, PE, and Clon produced changes in GC membrane potential similar to those observed in normal ACSF. I: Group data for experiments shown in (F–H). J–M: In the presence CNQX-APV-gabazine, GCs were depolarized by steady positive current injection to elicit spiking activity. A low concentration of NE (0.1 µM) hyperpolarized and decreased the firing rate of GCs (J). 10 µM NE (K) and PE (L) depolarized and increased the firing rate of GCs, while Clon hyperpolarized and decreased the firing frequency (M). N: Group data for experiments shown in (J–M). Note that application of NE in the presence of Idaz (10 µM) and Praz (1 µM) (NE+Praz+Ida) did not significantly alter membrane potential or firing rate. *p<0.05 compared to control, paired t-tests. The normalized firing frequency was calculated as: (firing frequency at the end of drug application – basal frequency)/basal frequency.
Figure 2
Figure 2
GCs express α1 and α2 receptors. A1–2: Traces showing the opposing effects of PE (10 µM) and Clon (10 µM) on the same GC. B1: In 9 GCs tested in normal ACSF, PE increased, but Clon decreased, spontaneous spiking. B2: In the same cells as in (B1), PE and Clon induced depolarization and hyperpolarization, respectively. C1 and C2: In the presence of APV-CNQX-gabazine, 5 GCs tested responded to PE and Clon in a manner similar to that observed in normal ACSF; cells were depolarized by steady positive current injection to elicit spiking activity as in Figure 1J–M. *mean values differ significantly than basal values, p<0.05, paired t-tests.
Figure 3
Figure 3
GC excitability and GABAergic inhibition of mitral cells is bi-directionally regulated by NE in a concentration-dependent manner. A: Group data from GC current clamp recordings in the presence of CNQX-APV-gabazine show that 0.1–1 µM NE hyperpolarized and reduced the spike discharge rate compared to the pre-NE baseline. By contrast, 10 µM NE depolarized and increased the discharge rate of GCs. GC membrane potential is expressed as absolute change from baseline, while discharge is normalized to a baseline value of 1.0. Data from 0.1–1 µM and 10 µM NE were obtained from separate groups of GCs; n=6–7 GCs for each concentration, *p<0.05, Anova followed by Newman-Keuls tests (0–1 µM data) or paired t-test (10 µM data). The level of GABAergic inhibition of mitral cells, expressed as the normalized frequency of mIPSCs, was bi-directionally modified by NE with a decrease elicited by NE concentrations less than 1.0 µM NE and an increase with 10 µM NE; #p<0.05, n=6–12 mitral cells per concentration. Mitral cell data were adapted from Fig. 6B in Nai et al. (2009) and mIPSCs were recorded in the presence of CNQX-APV-gabazine-TTX (1 µM). The frequency of GC spiking and mitral cell IPSCs was calculated as: frequency at the end of drug application/basal frequency. B: Open circles show group data illustrating concentration-dependent effects of NE on GC firing rate (in APV-CNQX gabazine); replotted from (A). Closed circles show the effects when 0.3 and 1 µM NE were applied in the presence of Idaz (10 µM), and when 10 µM NE was applied in the presence of Praz (1 µM). Open diamond symbol shows that NE was without affect when applied in the presence of Idaz and Praz combined. C: The experimental conditions and cells are identical to (B), except that change in membrane potential is illustrated. *p<0.05 (B–C), Anova followed by Newman-Keuls tests.
Figure 4
Figure 4
Superimposed current clamp traces showing membrane potential responses to +20 pA and −50 pA current steps before and during application of NE and receptor agonists (each at 10 µM) in the presence of APV-CNQX-gabazine. A–B: NE and PE increased evoked discharge to positive current injection and increased hyperpolarizing responses to negative current injection. C: Clonidine decreased evoked discharge and decreased hyperpolarization to negative current injection. D–E: Group data summary of the effects of NE and receptor agonists on the number of spikes/pulse (D) and changes in membrane resistance (E). *p<0.05; n=8–14 cells per group, paired t-tests.
Figure 5
Figure 5
Effects of NE and α1 and α2 receptor agonists on GC membrane currents. Membrane currents produced by slow voltage ramps (−120 to −10 mV) were recorded in the presence of TTX (1 µM), CNQX(10 µM), APV(50 µM), gabazine (10 µM), NiCl2 (100 µM) and CdCl2 (100 µM). Figures show I–V plots before (basal) and during NE or agonist application, as well as difference curves obtained by subtraction of the basal and NE/agonist plots; insets show enlarged difference curve. A–B: NE (A, 10 µM, n=5) and PE (B, 10 µM, n=5) induced an inward current that progressively increases at membrane potentials from −120 to −10 mV. The NE and PE current reversed in polarity at −95.8 ± 4.3 mV and −94.9 ± 4.1 mV, respectively. C: Clonidine (10 µM, n=10) induced an outward current with a reversal potential of −93.1 ± 2.4 mV). D: Group data showing the amplitude of the NE and agonist currents at −60 mV. *p<0.05, paired t-tests.

Similar articles

Cited by

References

    1. Araneda RC, Firestein S. Adrenergic enhancement of inhibitory transmission in the accessory olfactory bulb. J Neurosci. 2006;26(12):3292–3298. - PMC - PubMed
    1. Aston-Jones G, Rajkowski J, Kubiak P, Alexinsky T. Locus coeruleus neurons in monkey are selectively activated by attended cues in a vigilance task. J Neurosci. 1994;14:4467–4480. - PMC - PubMed
    1. Bergles DW, Doze VA, Madison DV, Smith SJ. Excitatory actions of norepinephrine of multiple classes of hippocampal CA1 interneurons. J Neurosci. 1996;16:572–585. - PMC - PubMed
    1. Berridge C, Waterhouse B. The locus coeruleus-noradrenergic system: modulation of behavioral state and state-dependent cognitive processes. Brain Res Rev. 2003;42:33–84. - PubMed
    1. Czesnik D, Nezlin L, Rabba J, Muller B, Schild D. Noradrenergic modulation of calcium currents and synaptic transmission in the olfactory bulb of Xenopus laevis. Eur J Neursci. 2001;13:1093–1100. - PubMed

Publication types

MeSH terms

Substances