Serum iPTH, calcium and phosphate, and the risk of mortality in a European haemodialysis population
- PMID: 20466670
- PMCID: PMC3107766
- DOI: 10.1093/ndt/gfq219
Serum iPTH, calcium and phosphate, and the risk of mortality in a European haemodialysis population
Abstract
Background: A number of US observational studies reported an increased mortality risk with higher intact parathyroid hormone (iPTH), calcium and/or phosphate. The existence of such a link in a European haemodialysis population was explored as part of the Analysing Data, Recognising Excellence and Optimising Outcomes (ARO) Chronic Kidney Disease (CKD) Research Initiative.
Methods: The association between the markers of mineral and bone disease and clinical outcomes was examined in 7970 patients treated in European Fresenius Medical Care facilities over a median of 21 months. Baseline and time-dependent (TD) Cox regression were performed using Kidney Disease Outcomes Quality Initiative (KDOQI) target ranges as reference categories, adjusting for demographics, medical history, dialysis parameters, inflammation, medications and laboratory parameters. Fractional polynomial (FP) models were also used.
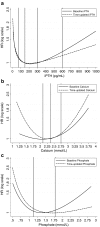
Results: Hazard ratio (HR) estimates from baseline analysis for iPTH were U-shaped [>600 pg/mL, HR = 2.10, 95% confidence interval (CI) 1.62-2.73; <75 pg/mL, HR = 1.46, 95% CI 1.17-1.83]. TD analysis confirmed the results for iPTH. Baseline analysis showed that calcium >2.75 mmol/L increased risk of death (HR = 1.70, 95% CI 1.19-2.42). TD analysis showed that both low (HR = 1.19, 95% CI 1.04-1.37) and high calcium (HR = 1.74, 95% CI 1.30-2.34) increased risk of death. Baseline analysis for phosphate showed a U-shaped pattern (<1.13 mmol/L, HR = 1.18, 95% CI 1.01-1.37; >1.78 mmol/L, HR = 1.32, 95% CI 1.13-1.55). TD analysis confirmed the results for phosphate <1.13 mmol/L. HR estimates were higher in patients with diabetes versus those without diabetes for baseline analysis only (P-value = 0.014). FP analysis confirmed the results of baseline and TD analyses.
Conclusion: Patients with iPTH, calcium and phosphate levels within the KDOQI target ranges have the lowest risk of mortality compared with those outside the target ranges.
Figures


Comment in
-
Phosphate binders in a European haemodialysis population.Nephrol Dial Transplant. 2011 Jun;26(6):2057-8; author reply 2058. doi: 10.1093/ndt/gfr034. Epub 2011 Mar 17. Nephrol Dial Transplant. 2011. PMID: 21414974 No abstract available.
References
-
- Block GA, Hulbert-Shearon TE, Levin NW, Port FK. Association of serum phosphorus and calcium × phosphate product with mortality risk in chronic hemodialysis patients: a national study. Am J Kidney Dis. 1998;31:607–617. - PubMed
-
- Block GA, Klassen PS, Lazarus JM, Ofsthun N, Lowrie EG, Chertow GM. Mineral metabolism, mortality, and morbidity in maintenance hemodialysis. J Am Soc Nephrol. 2004;15:2208–2218. - PubMed
-
- Young EW, Albert JM, Satayathum S, et al. Predictors and consequences of altered mineral metabolism: the Dialysis Outcomes and Practice Patterns Study. Kidney Int. 2005;67:1179–1187. - PubMed
-
- Kalantar-Zadeh K, Kuwae N, Regidor DL, et al. Survival predictability of time-varying indicators of bone disease in maintenance hemodialysis patients. Kidney Int. 2006;70:771–780. - PubMed
-
- Wald R, Sarnak MJ, Tighiouart H, et al. Disordered mineral metabolism in hemodialysis patients: an analysis of cumulative effects in the Hemodialysis (HEMO) Study. Am J Kidney Dis. 2008;52:531–540. - PubMed
MeSH terms
Substances
LinkOut - more resources
Full Text Sources
Other Literature Sources
Medical

