Sirolimus therapy to halt the progression of ADPKD
- PMID: 20466742
- PMCID: PMC2900967
- DOI: 10.1681/ASN.2009121302
Sirolimus therapy to halt the progression of ADPKD
Abstract
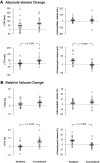
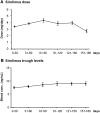
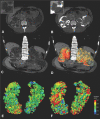
Activation of mammalian target of rapamycin (mTOR) pathways may contribute to uncontrolled cell proliferation and secondary cyst growth in patients with autosomal dominant polycystic kidney disease (ADPKD). To assess the effects of mTOR inhibition on disease progression, we performed a randomized, crossover study (The SIRENA Study) comparing a 6-month treatment with sirolimus or conventional therapy alone on the growth of kidney volume and its compartments in 21 patients with ADPKD and GFR>or=40 ml/min per 1.73 m2. In 10 of the 15 patients who completed the study, aphthous stomatitis complicated sirolimus treatment but was effectively controlled by topical therapy. Compared with pretreatment, posttreatment mean total kidney volume increased less on sirolimus (46+/-81 ml; P=0.047) than on conventional therapy (70+/-72 ml; P=0.002), but we did not detect a difference between the two treatments (P=0.45). Cyst volume was stable on sirolimus and increased by 55+/-75 ml (P=0.013) on conventional therapy, whereas parenchymal volume increased by 26+/-30 ml (P=0.005) on sirolimus and was stable on conventional therapy. Percentage changes in cyst and parenchyma volumes were significantly different between the two treatment periods. Sirolimus had no appreciable effects on intermediate volume and GFR. Albuminuria and proteinuria marginally but significantly increased during sirolimus treatment. In summary, sirolimus halted cyst growth and increased parenchymal volume in patients with ADPKD. Whether these effects translate into improved long-term outcomes requires further investigation.
Figures


Comment in
-
Randomized intervention studies in human polycystic kidney and liver disease.J Am Soc Nephrol. 2010 Jun;21(6):891-3. doi: 10.1681/ASN.2010030262. Epub 2010 Apr 29. J Am Soc Nephrol. 2010. PMID: 20431043 No abstract available.
-
Polycystic kidney disease: Promising new potential therapies for patients with autosomal dominant polycystic kidney disease.Nat Rev Nephrol. 2010 Aug;6(8):443. doi: 10.1038/nrneph.2010.87. Nat Rev Nephrol. 2010. PMID: 20690198 No abstract available.
References
-
- Ecter T, Fick-Brosnahan GM, Schrier RW: Polycystic kidney disease. In: Diseases of the Kidney and Urinary Tract, 8th Ed., edited by Schrier RW. Philadelphia, Lippincott Williams & Wilkins, 2007, pp 502–539
-
- Harris PC: 2008 Homer W. Smith Award: Insights into the pathogenesis of polycystic kidney disease from gene discovery. J Am Soc Nephrol 20: 1188–1198, 2009. - PubMed
-
- Kottgen M: TRPP2 and autosomal dominant polycystic kidney disease. Biochim Biophys Acta 1772: 836–850, 2007. - PubMed
-
- Yamaguchi T, Hempson SJ, Reif GA, Hedge AM, Wallace DP: Calcium restores a normal proliferation phenotype in human polycystic kidney disease epithelial cells. J Am Soc Nephrol 17: 178–187, 2006. - PubMed
-
- Gattone VH, 2nd, Wang X, Harris PC, Torres VE: Inhibition of renal cystic disease development and progression by a vasopressin V2 receptor antagonist. Nat Med 9: 1323–1326, 2003. - PubMed
Publication types
MeSH terms
Substances
LinkOut - more resources
Full Text Sources
Miscellaneous

