. 2010 Aug;30(8):1583-90.
doi: 10.1161/ATVBAHA.110.205757. Epub 2010 May 13.

The mouse atherosclerosis locus at chromosome 10 (Ath11) acts early in lesion formation with subcongenic strains delineating 2 narrowed regions

Affiliations

The mouse atherosclerosis locus at chromosome 10 (Ath11) acts early in lesion formation with subcongenic strains delineating 2 narrowed regions

Susanne Wolfrum et al. Arterioscler Thromb Vasc Biol. 2010 Aug.

Abstract

Objective: Ath11, an atherosclerosis susceptibility locus on proximal chromosome 10 (0 to 21 cM) revealed in a cross between apolipoprotein E deficient C57BL/6 (B6) and FVB mice, was recently confirmed in congenic mice. The objectives of this study were to assess how Ath11 affects lesion development and morphology, to determine aortic gene expression in congenics, and to narrow the congenic interval.

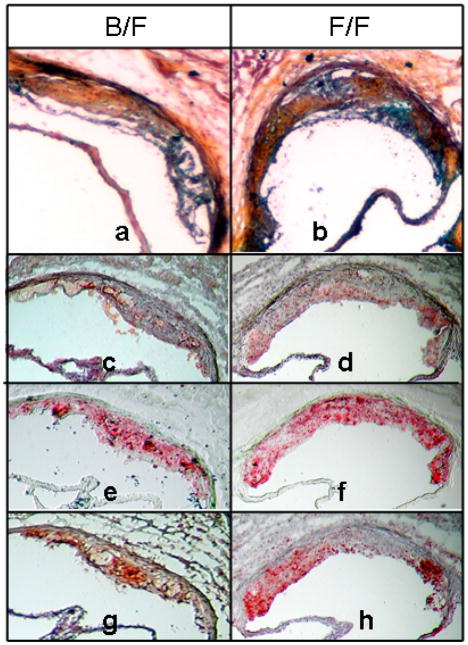
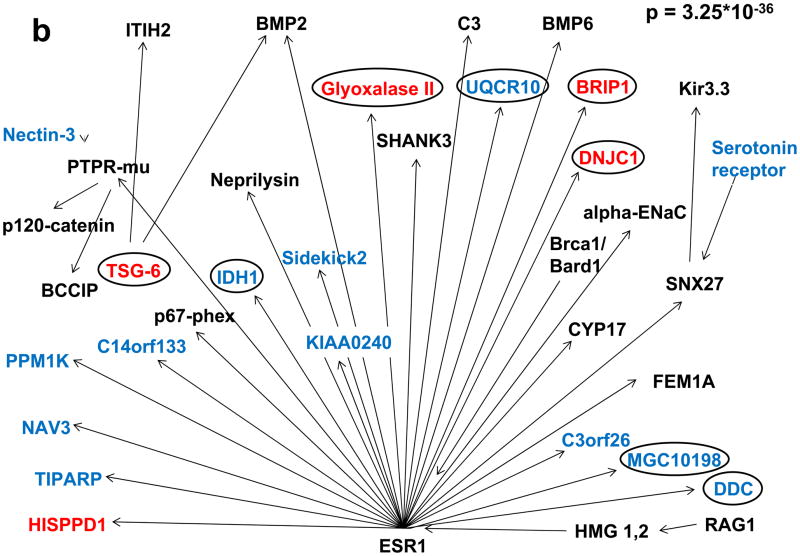
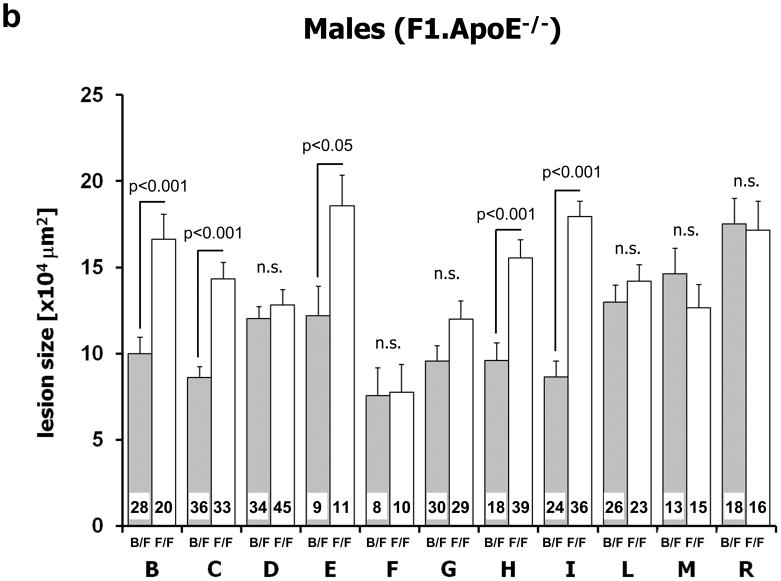
Methods and results: Assessing lesion area over time in congenic mice showed that homozygosity for the FVB allele increased lesion area at 6 weeks persisting through to 24 weeks of age. Staining of aortic root sections at 16 weeks did not reveal obvious differences between congenics. Aortic expression-array analysis at 6 weeks revealed 97 genes that were >2-fold regulated, including 1 gene in the quantitative trait locus interval, Aldh8a1, and 2 gene clusters regulated by Hnf4alpha and Esr1. Analysis of lesion area in 11 subcongenic strains revealed 2 narrowed regions, 10a (21 genes), acting in females, and 10b (7 genes), acting in both genders.

Conclusions: Ath11 appears to act early in lesion formation, with significant effects on aortic gene expression. This quantitative trait locus is genetically complex, containing a female-specific region 10a from 0 to 7.3 megabases (21 genes) and a gender-independent region 10b from 20.1 to 21.9 megabases (7 genes).


Figures

Figure 1
Figure 1
Effect of the proximal Chr10 interval (0–21 cM) on atherosclerosis development over time in F1.Apoe−/− congenic mice (a: males and b: females). Atherosclerotic lesion size was measured at 6, 12, 16, 20 and 24 weeks of age. The genetics of the proximal 0–21.9 cM of Chr10 are F1.Apoe−/−Chr10B6/B6, F1.Apoe−/−Chr10B6/FVB, and F1.Apoe−/−Chr10FVB/FVB indicated in the figure as B/B (black bars), B/F (grey bars), and F/F (white bars), respectively. The numbers of mice for each genotype and for each time point are shown at the bottom of the bars. Values represent means ± SEM.
Figure 1
Figure 1
Effect of the proximal Chr10 interval (0–21 cM) on atherosclerosis development over time in F1.Apoe−/− congenic mice (a: males and b: females). Atherosclerotic lesion size was measured at 6, 12, 16, 20 and 24 weeks of age. The genetics of the proximal 0–21.9 cM of Chr10 are F1.Apoe−/−Chr10B6/B6, F1.Apoe−/−Chr10B6/FVB, and F1.Apoe−/−Chr10FVB/FVB indicated in the figure as B/B (black bars), B/F (grey bars), and F/F (white bars), respectively. The numbers of mice for each genotype and for each time point are shown at the bottom of the bars. Values represent means ± SEM.
Figure 2
Figure 2
Frozen aortic root sections of male F1.Apoe−/−Chr10B6/FVB (left panels) and F1.Apoe−/−Chr10FVB/FVB congenic mice (right panels) sacrificed at 16 weeks of age. Panels a and b: Movats stain (100x), panels c and d: CD68 staining for macrophages (red), panels e and f: Oil Red-O staining for lipid (red), panels g and h: TUNEL staining for apoptosis (red). Panels c, e, and g show serial sections as do panels d, f, and h.
Figure 3
Figure 3
Transcription factor analysis of genes for which expression in aortic tissue differed by more than 2 fold between F1.Apoe−/−Chr10B6/B6 and F1.Apoe−/− Chr10FVB/FVB congenic mice, utilizing the GeneGo MetaCore database, detected two significant clusters of differentially regulated genes driven by (a) Hnf4α and (b) Esr1. Genes colored in blue were down- and genes colored in red up-regulated in F1.Apoe−/−Chr10B6/B6 vs. F1.Apoe−/−Chr10FVB/FVB congenic mice. Unregulated genes of the network are shown in black. Circles mark genes that were regulated in a similar manner when F1.Apoe−/−Chr10B6/FVB and F1.Apoe−/−Chr10FVB/FVB congenic mice were compared.
Figure 3
Figure 3
Transcription factor analysis of genes for which expression in aortic tissue differed by more than 2 fold between F1.Apoe−/−Chr10B6/B6 and F1.Apoe−/− Chr10FVB/FVB congenic mice, utilizing the GeneGo MetaCore database, detected two significant clusters of differentially regulated genes driven by (a) Hnf4α and (b) Esr1. Genes colored in blue were down- and genes colored in red up-regulated in F1.Apoe−/−Chr10B6/B6 vs. F1.Apoe−/−Chr10FVB/FVB congenic mice. Unregulated genes of the network are shown in black. Circles mark genes that were regulated in a similar manner when F1.Apoe−/−Chr10B6/FVB and F1.Apoe−/−Chr10FVB/FVB congenic mice were compared.
Figure 4
Figure 4
Analysis of atherosclerosis lesion size in subcongenic strains. Panel a: Schematic illustration of the subcongenic strains on an F1 background. The horizontal bar indicates the extent of the genomic interval for each subcongenic strain. The dotted lines at either side of a bar indicate the region in which the recombination occurred. A black bar describes a subcongenic strain that showed increased lesion area in FF vs. BF mice, a white bar a strain that did not, and a gray bar a strain that showed increased lesion area only when female FF vs BF mice were compared. Panels b (males) and c (females): Effect of different proximal Chr10 intervals on atherosclerosis lesion size. For each subcongenic strain the gray column indicates heterozygousity (B/F) and the white column homozygousity (F/F) in the interval. At the bottom of each column the numbers of mice studied with that genotype are indicated. Values represent means ± SEM.
Figure 4
Figure 4
Analysis of atherosclerosis lesion size in subcongenic strains. Panel a: Schematic illustration of the subcongenic strains on an F1 background. The horizontal bar indicates the extent of the genomic interval for each subcongenic strain. The dotted lines at either side of a bar indicate the region in which the recombination occurred. A black bar describes a subcongenic strain that showed increased lesion area in FF vs. BF mice, a white bar a strain that did not, and a gray bar a strain that showed increased lesion area only when female FF vs BF mice were compared. Panels b (males) and c (females): Effect of different proximal Chr10 intervals on atherosclerosis lesion size. For each subcongenic strain the gray column indicates heterozygousity (B/F) and the white column homozygousity (F/F) in the interval. At the bottom of each column the numbers of mice studied with that genotype are indicated. Values represent means ± SEM.

References

    1. Glazier AM, Nadeau JH, Aitman TJ. Finding genes that underlie complex traits. Science. 2002;298:2345–2349. - PubMed
    1. Dansky HM, Charlton SA, Sikes JL, Heath SC, Simantov R, Levin LF, Shu P, Moore KJ, Breslow JL, Smith JD. Genetic background determines the extent of atherosclerosis in ApoE-deficient mice. Arterioscler Thromb Vasc Biol. 1999;19:1960–1968. - PubMed
    1. Teupser D, Persky AD, Breslow JL. Induction of atherosclerosis by low-fat, semisynthetic diets in LDL receptor-deficient C57BL/6J and FVB/NJ mice: comparison of lesions of the aortic root, brachiocephalic artery, and whole aorta (en face measurement) Arterioscler Thromb Vasc Biol. 2003;23:1907–1913. - PubMed
    1. Dansky HM, Shu P, Donavan M, Montagno J, Nagle DL, Smutko JS, Roy N, Whiteing S, Barrios J, McBride TJ, Smith JD, Duyk G, Breslow JL, Moore KJ. A phenotype-sensitizing Apoe-deficient genetic background reveals novel atherosclerosis predisposition loci in the mouse. Genetics. 2002;160:1599–1608. - PMC - PubMed
    1. Teupser D, Tan M, Persky AD, Breslow JL. Atherosclerosis quantitative trait loci are sex- and lineage-dependent in an intercross of C57BL/6 and FVB/N low-density lipoprotein receptor-/- mice. Proc Natl Acad Sci U S A. 2006;103:123–128. - PMC - PubMed

Publication types

MeSH terms