. 2010 Sep;9(9):1920-36.
doi: 10.1074/mcp.M900345-MCP200. Epub 2010 May 13.

Quantitative proteomics using stable isotope labeling with amino acids in cell culture reveals changes in the cytoplasmic, nuclear, and nucleolar proteomes in Vero cells infected with the coronavirus infectious bronchitis virus

Affiliations

Quantitative proteomics using stable isotope labeling with amino acids in cell culture reveals changes in the cytoplasmic, nuclear, and nucleolar proteomes in Vero cells infected with the coronavirus infectious bronchitis virus

Edward Emmott et al. Mol Cell Proteomics. 2010 Sep.

Abstract

Virus-host interactions involve complex interplay between viral and host factors, rendering them an ideal target for proteomic analysis. Here we detail a high throughput quantitative proteomics analysis of Vero cells infected with the coronavirus infectious bronchitis virus (IBV), a positive strand RNA virus that replicates in the cytoplasm. Stable isotope labeling with amino acids in cell culture (SILAC) was used in conjunction with LC-MS/MS to identify and quantify 1830 cellular and two viral proteins from IBV-infected cells. Fractionation of cells into cytoplasmic, nuclear, and nucleolar extracts was used to reduce sample complexity and provide information on the trafficking of proteins between the different compartments. Each fraction showed a proportion of proteins exhibiting >or=2-fold changes in abundance. Ingenuity Pathway Analysis revealed that proteins that changed in response to infection could be grouped into different functional categories. These included proteins regulated by NF-kappaB- and AP-1-dependent pathways and proteins involved in the cytoskeleton and molecular motors. A luciferase-based reporter gene assay was used to validate the up-regulation of AP-1- and NF-kappaB-dependent transcription in IBV-infected cells and confirmed using immunofluorescence. Immunofluorescence was used to validate changes in the subcellular localization of vimentin and myosin VI in IBV-infected cells. The proteomics analysis also confirmed the presence of the viral nucleocapsid protein as localizing in the cytoplasm, nucleus, and nucleolus and the viral membrane protein in the cytoplasmic fraction. This research is the first application of SILAC to study total host cell proteome changes in response to positive sense RNA virus infection and illustrates the versatility of this technique as applied to infectious disease research.


Figures
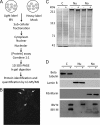
Fig. 1.
Fig. 1.
A, diagrammatic representation of the high throughput quantitative experimental approach taken in this study to investigate changes in the cellular proteome in response to infection with IBV. B, immunofluorescence analysis using confocal microscopy of IBV-infected cells, examples of which are marked with arrows. C, cytoplasmic (C), nuclear (Nu), and nucleolar (No) proteomes purified from mock- (−) and IBV-infected (+) cells. Molecular mass is shown to the left. D, Western blot analysis of the cytoplasmic (C), nuclear (Nu), and nucleolar (No) extracts using antibodies to specific markers for each fraction, tubulin-1 for the cytoplasm, lamin B-1 for the nucleus, and fibrillarin for the nucleolus.
Fig. 2.
Fig. 2.
Amino acid sequence of IBV N and M protein sequences showing peptide coverage (bold and italic) on proteins identified from nuclear, cytoplasmic, and nucleolar extracts. Mascot score and percent peptide coverage are provided.
Fig. 3.
Fig. 3.
Analysis of relative proportion of different protein groups and functional classes (indicated in legend) in nuclear, cytoplasmic, and nucleolar proteomes of Vero cells. For orientation, the first grouping, protein synthesis, is to the right of the 12 o'clock position. Protein synthesis, cellular growth and proliferation, and gene expression are indicated as PS, CG&P, and GE, respectively.
Fig. 4.
Fig. 4.
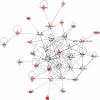
Ingenuity Pathway Analysis of proteins predominately associated with assembly and organization in nuclear proteome. Proteins shaded in green indicate 2-fold or more depleted in IBV-infected cells, and proteins shaded in red indicate 2-fold or more increased in the nuclear proteome. Proteins in gray were identified in the analysis but did not meet the 2-fold specified cutoff value between mock- and IBV-infected cells. Proteins in white are those identified from the Ingenuity Pathways Knowledge Base. The shapes are indicative of the molecular class (i.e. protein family) (see supplemental Fig. 2 for the legend). Lines connecting the molecules indicate molecular relationships. There are two line styles; dashed lines indicate indirect interactions, and solid lines indicate direct interactions. The style of the arrows indicates specific molecular relationships and the directionality of the interaction (A acts on B).
Fig. 5.
Fig. 5.
Ingenuity Pathway Analysis of proteins predominately associated with cellular assembly and organization in cytoplasmic proteome. Proteins shaded in green indicate 2-fold or more depleted in IBV-infected cells, and proteins shaded in red indicate 2-fold or more increased in the nuclear proteome. Proteins in gray were identified in the analysis but did not meet the 2-fold specified cutoff value between mock- and IBV-infected cells. Proteins in white are those identified from the Ingenuity Pathways Knowledge Base. The shapes are indicative of the molecular class (i.e. protein family) (see supplemental Fig. 2 for the legend). Lines connecting the molecules indicate molecular relationships. There are two line styles; dashed lines indicate indirect interactions, and solid lines indicate direct interactions. The style of the arrows indicates specific molecular relationships and the directionality of the interaction (A acts on B).
Fig. 6.
Fig. 6.
Ingenuity Pathway Analysis of proteins predominately associated with cell growth and interaction in nucleolar proteome. Proteins shaded in green indicate 2-fold or more depleted in IBV-infected cells, and proteins shaded in red indicate 2-fold or more increased in the nuclear proteome. Proteins in gray were identified in the analysis but did not meet the 2-fold specified cutoff value between mock- and IBV-infected cells. Proteins in white are those identified from the Ingenuity Pathways Knowledge Base. The shapes are indicative or the molecular class (i.e. protein family) (see supplemental Fig. 2 for the legend). Lines connecting the molecules indicate molecular relationships. There are two line styles; dashed lines indicate indirect interactions, and solid lines indicate direct interactions. The style of the arrows indicates specific molecular relationships and the directionality of the interaction (A acts on B).
Fig. 7.
Fig. 7.
A, histogram of the luciferase reporter gene assays to assess the relative level of AP-1- and NF-κB-driven transcription in mock-, Sendai virus-, and IBV-infected cells. Data are an average of 12 independent experiments. B, indirect immunofluorescence confocal microscopy analysis of the localization of either p50 or RelA (both green) in either mock- or IBV-infected (red) cells. Nuclei are stained with DAPI, and a merged image is also presented. ConA, concanavalin A.
Fig. 8.
Fig. 8.
Indirect immunofluorescence analysis using confocal microscopy of MYO6 (A) or vimentin (B) in mock- or IBV-infected cells. MYO6 and vimentin are shown in green, nuclei are stained with DAPI (blue), and IBV proteins are shown in red. A merged image is also presented. For A, two examples of IBV-infected cells are shown: top, the MYO6 cytoplasmic signal is in the same linear range as the MYO6 signal in the mock-infected cells; bottom, the MYO6 signal in the nucleus is in the linear range. Note that the IBV-infected cells identified in B are an example of virus-induced syncytia.
Fig. 9.
Fig. 9.
Comparison of relative abundance of proteins identified in nucleolus in cells infected with either IBV (black) or adenovirus (gray). Selected gene names are used as identifiers.

References

    1. Dove B., Brooks G., Bicknell K., Wurm T., Hiscox J. A. (2006) Cell cycle perturbations induced by infection with the coronavirus infectious bronchitis virus and their effect on virus replication. J. Virol. 80, 4147–4156 - PMC - PubMed
    1. Chen C. J., Makino S. (2004) Murine coronavirus replication induces cell cycle arrest in G0/G1 phase. J. Virol. 78, 5658–5669 - PMC - PubMed
    1. Chen C. J., Sugiyama K., Kubo H., Huang C., Makino S. (2004) Murine coronavirus nonstructural protein p28 arrests cell cycle in G0/G1 phase. J. Virol. 78, 10410–10419 - PMC - PubMed
    1. Li F. Q., Tam J. P., Liu D. X. (2007) Cell cycle arrest and apoptosis induced by the coronavirus infectious bronchitis virus in the absence of p53. Virology 365, 435–445 - PMC - PubMed
    1. Belyavsky M., Belyavskaya E., Levy G. A., Leibowitz J. L. (1998) Coronavirus MHV-3-induced apoptosis in macrophages. Virology 250, 41–49 - PMC - PubMed

Publication types

LinkOut - more resources