. 2010 Aug;27(8):1530-46.
doi: 10.1007/s11095-010-0163-1. Epub 2010 May 14.

Simulating dissolution of intravitreal triamcinolone acetonide suspensions in an anatomically accurate rabbit eye model

Affiliations

Simulating dissolution of intravitreal triamcinolone acetonide suspensions in an anatomically accurate rabbit eye model

Paul J Missel et al. Pharm Res. 2010 Aug.

Abstract

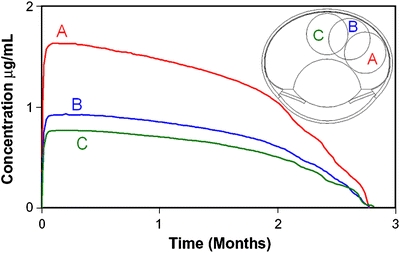
Purpose: A computational fluid dynamics (CFD) study examined the impact of particle size on dissolution rate and residence of intravitreal suspension depots of Triamcinolone Acetonide (TAC).

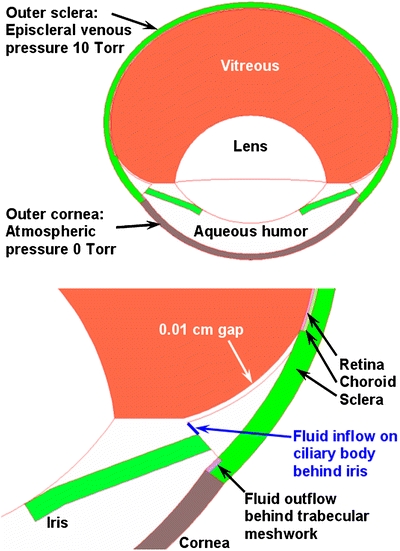
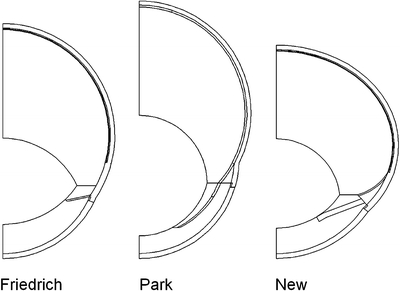
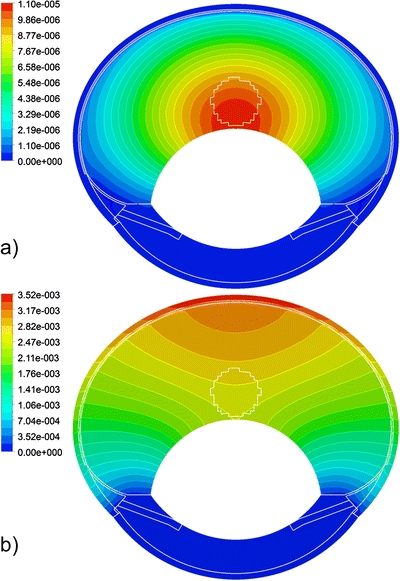
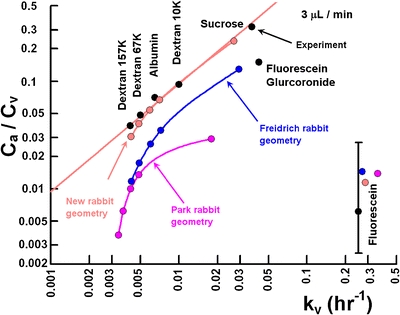
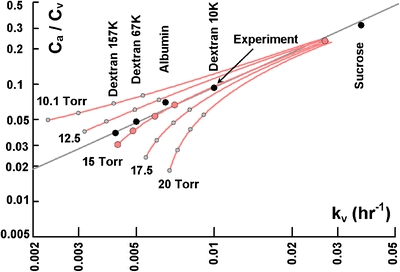
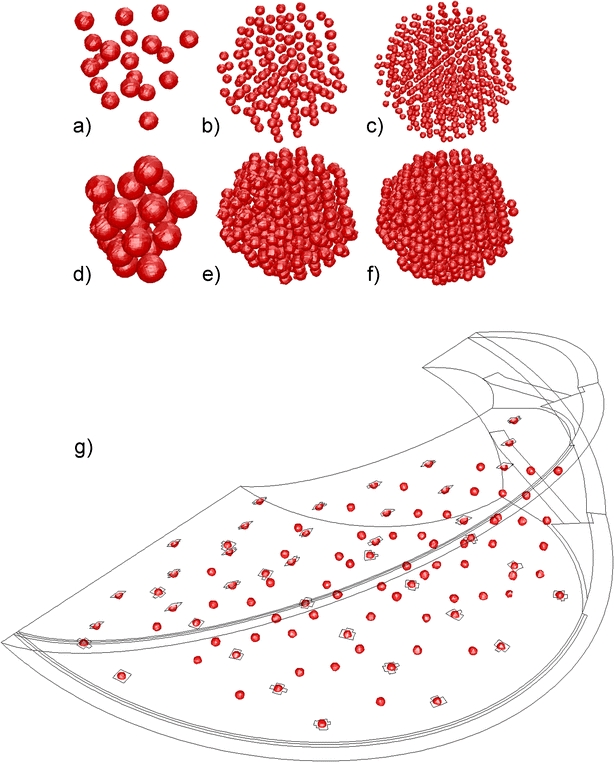
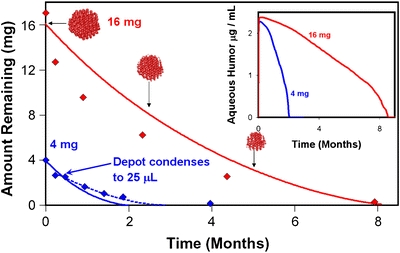
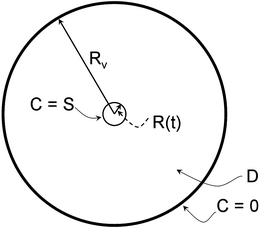
Methods: A model for the rabbit eye was constructed using insights from high-resolution NMR imaging studies (Sawada 2002). The current model was compared to other published simulations in its ability to predict clearance of various intravitreally injected materials. Suspension depots were constructed explicitly rendering individual particles in various configurations: 4 or 16 mg drug confined to a 100 microL spherical depot, or 4 mg exploded to fill the entire vitreous. Particle size was reduced systematically in each configuration. The convective diffusion/dissolution process was simulated using a multiphase model.

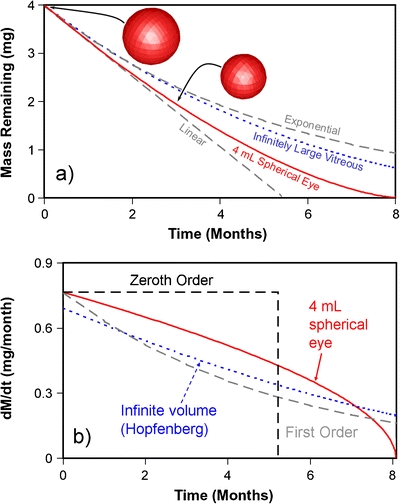
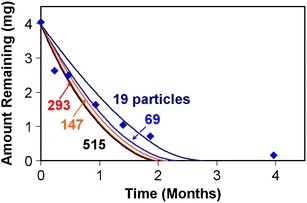
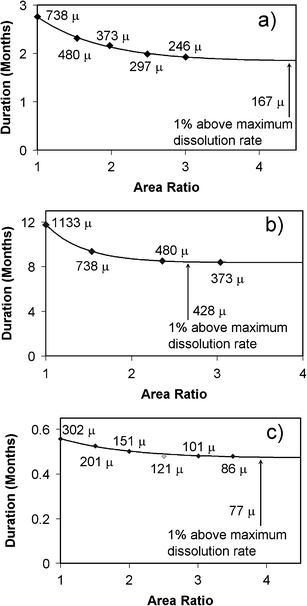
Results: Release rate became independent of particle diameter below a certain value. The size-independent limits occurred for particle diameters ranging from 77 to 428 microM depending upon the depot configuration. Residence time predicted for the spherical depots in the size-independent limit was comparable to that observed in vivo.

Conclusions: Since the size-independent limit was several-fold greater than the particle size of commercially available pharmaceutical TAC suspensions, differences in particle size amongst such products are predicted to be immaterial to their duration or performance.


Figures

Fig. 1
Fig. 1
Rabbit ocular geometry for the new model proposed in this study showing the various fluid regions and key surfaces for mass flow inlet and pressure outlet boundary conditions.
Fig. 2
Fig. 2
Cross-sectional view of the ocular rabbit eye geometries for the three different models examined. The geometry labeled “New” pertains to the model proposed in this study.
Fig. 3
Fig. 3
Pathlines of flow seeded from the fluid inlet to the posterior aqueous humor. Colors indicate velocity (m/s). The velocity displayed is clipped to a maximum value of 5E-6 m/s.
Fig. 4
Fig. 4
a Pressure displayed on the symmetry surfaces (Torr). b Velocity, clipped to a maximum value of 10−8 m/s to illustrate contours in the vitreous. c Dissolved Triamcinolone Acetonide concentration (grams/ml) after the dissolution process has achieved steady state for a suspension of 16 mg Triamcinolone Acetonide divided into 276 particles confined to a 100 microliter intravitreal bolus.
Fig. 5
Fig. 5
Concentration profiles following central bolus injection of 10 μL intravitreal injection of a substance of concentration 1 (arbitrary units) in the current rabbit model. a Fluorescein, 105 s after injection. b 157 kD Dextran, 106 s after injection.
Fig. 6
Fig. 6
The clearance rates of various materials injected into the rabbit vitreous as predicted by the three ocular models compared with experiment.
Fig. 7
Fig. 7
Influence of intraocular pressure on the clearance rate of materials injected into the rabbit vitreous for the current geometry. The pressures indicated represent the maximum pressure in the eye.
Fig. 8
Fig. 8
a Validation of the method for simulating surface erosion of a 4 mg spherical drug particle assuming a solubility limit of 36 ppm, centered in a 4 mL spherical vitreous surrounded by an infinite sink. The inset shows the initial particle shape and the shape after half the material has eroded, demonstrating the orderly advancement of the dissolving front. The numerical results are indistinguishable from the exact solution (solid curve). The prediction for an infinitely large vitreous expanse (2) is included for reference (dotted curve). Also shown for comparison are linear and exponential curves extrapolated from the initial dissolution rate (dashed curves). b Rate of mass loss for the same model.
Fig. 9
Fig. 9
Arrangements for particle suspensions. 4 mg suspensions confined to 100 μL spherical depot: a 19 particles (738 μm); b 147 particles (373 μm); c 515 particles (246 μm). 16 mg suspensions confined to 100 μL spherical depot: d 21 particles (1133 μm); e 159 particles (577 μm); f 588 particles (373 μm). g 4 mg dispersed uniformly throughout the entire vitreous, 1/16th of the model shown. When replicated the entire vitreous contains 942 particles (201 μm). Sizes quoted are particle diameters.
Fig. 10
Fig. 10
Influence of the number of particles on dissolution for suspension models comprised of 4 mg of equally sized particles confined to a 100 μL spherical depot. Data points are from reference 5.
Fig. 11
Fig. 11
Influence of particle size on the duration of intravitreal suspensions. a 4 mg TAC confined to a 100 μL spherical depot. b 16 mg TAC confined to a 100 μL spherical depot. c 4 mg TAC dispersed throughout the entire vitreous. Trend curves represent best fits to a first order function (see text).
Fig. 12
Fig. 12
Dissolution profiles for 4 mg and 16 mg TAC confined to a 100 μL spherical vitreous depot compared with experimental data from reference 5. Curves represent results in the limit of infinitesimally small particles. The dashed curve for 4 mg restarts the simulation by distributing 2.7 mg of drug in a 25 μL depot to approximate the influence of depot condensation observed in vivo. The inset shows the mean aqueous humor concentrations predicted.
Fig. 13
Fig. 13
Dissolution profiles for 4 mg TAC divided amongst nineteen equally sized (738 μm) particles confined to a 100 μL spherical vitreous depot located in three different regions of the vitreous as shown in the inset.
Fig. 14
Fig. 14
Diagram for the reference calculation in the Appendix, a spherical drug bead dissolving in the center of an idealized spherical vitreous domain bounded by an infinite sink.

References

    1. Sawada T, Nakamura J, Nishida Y, Kani K, Morikawa S, Inubushi T. Magnetic resonance imaging studies of the volume of the rabbit eye with intravenous mannitol. Curr Eye Res. 2002;25:173–177. doi: 10.1076/ceyr.25.3.173.13474. - DOI - PubMed
    1. Sebag J. The vitreous: structure, function and pathobiology. New York: Springer-Verlag; 1989.
    1. Friedrich S, Cheng Y-L, Saville B. Finite element modeling of drug distribution in the vitreous humor of the rabbit eye. Ann Biomed Eng. 1997;25:303–314. doi: 10.1007/BF02648045. - DOI - PubMed
    1. Park J, Bungay PM, Lutz RJ, Augsburger JJ, Millard RW, Roy AS, et al. Evaluation of coupled convective–diffusive transport of drugs administered by intravitreal injection and controlled release implant. J Control Release. 2005;105:279–295. doi: 10.1016/j.jconrel.2005.03.010. - DOI - PubMed
    1. Kim H, Csaky KG, Gravlin L. Safety and pharmacokinetics of a preservative-free Triamcinolone Acetonide formulation for intravitreal administration. Retina. 2006;26:523–530. doi: 10.1097/00006982-200605000-00005. - DOI - PubMed