. 2010 Jul;58(9):1082-93.
doi: 10.1002/glia.20989.

IL-27 inhibits OSM-mediated TNF-alpha and iNOS gene expression in microglia

Affiliations

IL-27 inhibits OSM-mediated TNF-alpha and iNOS gene expression in microglia

Brandi J Baker et al. Glia. 2010 Jul.

Abstract

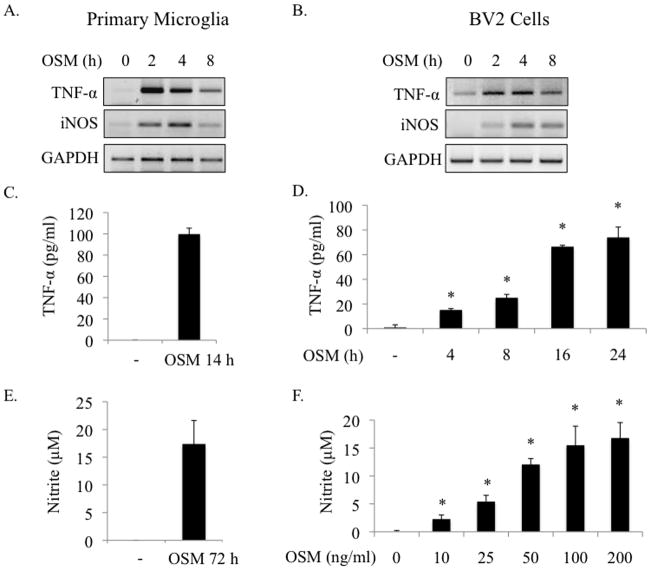
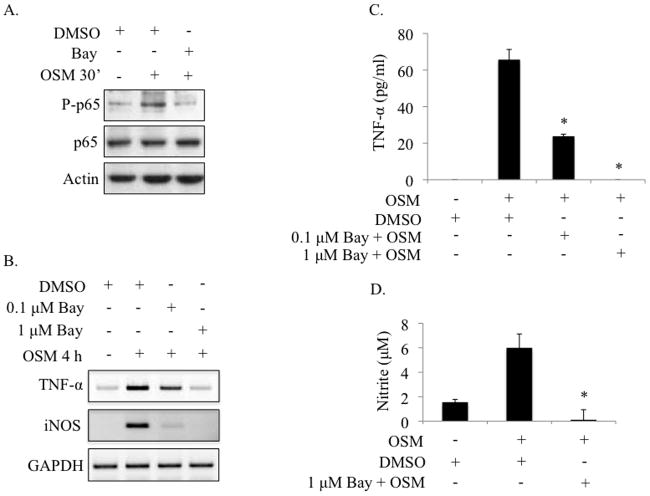
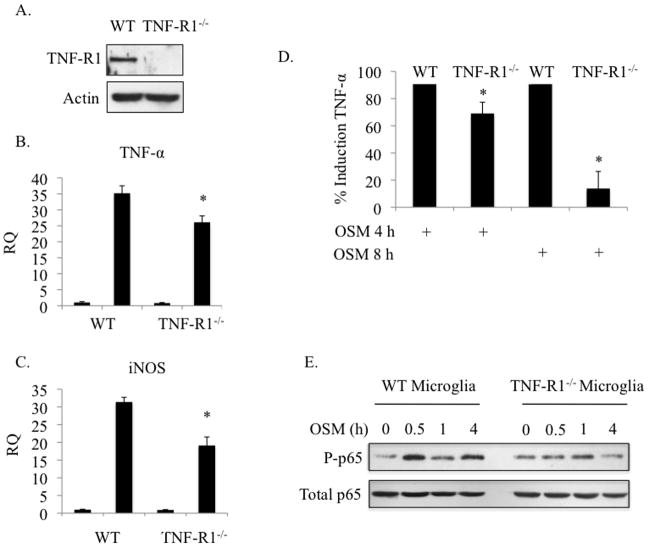
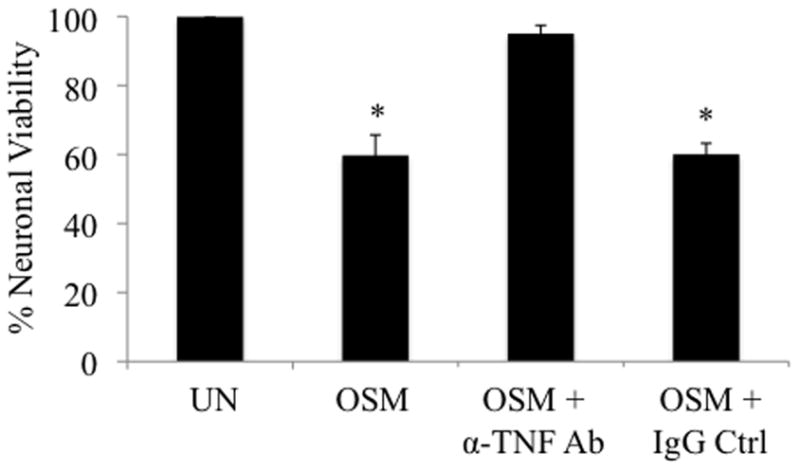
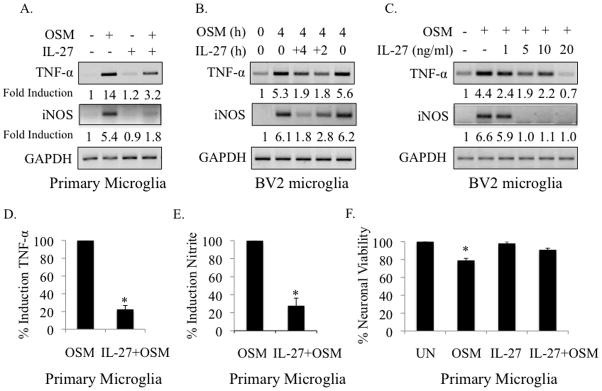
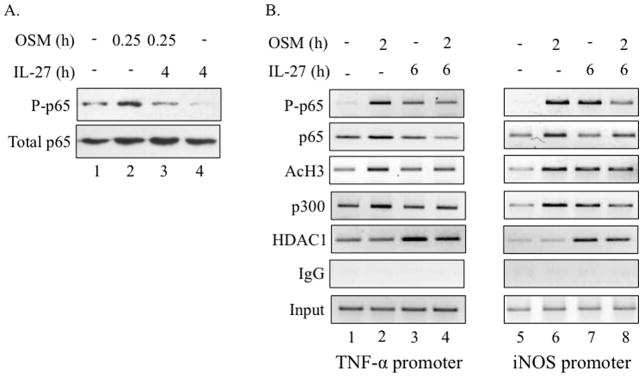
Elevated levels of Oncostatin M (OSM), an interleukin-6 family cytokine, have been observed in multiple sclerosis (MS), HIV-associated neurocognitive disorder (HAND), and glioblastoma (GBM); however, its effects within the CNS are not well understood. OSM regulates gene expression primarily by activating the JAK/STAT, NF-kappaB, and/or MAPK pathways, in a cell-type specific manner. In our studies, OSM induces the production of the proinflammatory cytokine tumor necrosis factor-alpha (TNF-alpha) and inducible nitric oxide synthase (iNOS) from microglia in an NF-kappaB-dependent manner. This expression also partially requires the intermediate production of TNF-alpha and subsequent NF-kappaB activation via TNF-R1. We also demonstrate that OSM-induced TNF-alpha production from microglia is neurotoxic. The IL-12 family member, IL-27, suppresses OSM-mediated TNF-alpha and iNOS expression at the transcriptional level by inhibiting activation of the NF-kappaB pathway, and rescues the neurotoxicity induced by OSM-stimulated microglia. These studies are the first to demonstrate the proinflammatory effects of OSM in microglia, and also identify IL-27 as a novel inhibitor of inflammatory processes in these cells.


Figures

Figure 1
Figure 1
OSM induces TNF-α and iNOS expression in microglia. A. B. Primary microglia or BV2 microglial cells were treated with OSM (10 ng/ml) for 0, 2, 4 or 8 h, and analyzed for TNF-α and iNOS mRNA expression by RT-PCR. GAPDH levels were assessed as a control for total mRNA. Representative of 3 independent experiments. C. Primary microglia were treated with OSM (10 ng/ml) for 14 h and supernatants assessed for TNF-α protein expression by ELISA. Mean +/− S.D. of 3 independent experiments. D. BV2 cells were treated with OSM (10 ng/ml) for 0, 4, 8, 16 or 24 h and supernatants analyzed for TNF-α protein expression by ELISA. Mean +/− S.D. of 2 independent experiments. E. Primary microglia were treated with OSM (10 ng/ml) for 72 h and supernatants were analyzed for production of nitrite, a stable end product of NO production, using the Griess reagent. Mean +/− S.D. of 3 independent experiments. F. BV2 cells were stimulated with increasing concentrations of OSM (0–200 ng/ml) for 72 h and supernatants were analyzed for nitrite production. Mean +/− S.D. of 3 independent experiments. * p-values < 0.05 were considered statistically significant.
Figure 2
Figure 2
OSM activates the NF-κB p65 pathway in microglia. A. B. Primary microglia and BV2 cells were treated with OSM (10 ng/ml) for the indicated times. Protein lysates were analyzed for P-p65ser276 (primary microglia), P-p65ser536 (BV2 cells), total p65, P-STAT3Tyr705, total STAT3 and actin (as a loading control) by immunoblotting. Representative of 3 independent experiments.
Figure 3
Figure 3
OSM-induced TNF-α and NO production requires activation of the NF-κB pathway. A. Primary microglia were pre-treated with 0.1% DMSO or 10 μM BAY 11-7085 for 1 h, followed by treatment with OSM (10 ng/ml) for 30 min. Protein lysates were collected and analyzed for P-p65Ser276, total p65 and actin by immunoblotting. Representative of 2 independent experiments. B. Primary microglia were pre-treated with 0.1% DMSO, 0.1 μM BAY 11-7085 or 1 μM BAY 11-7085 for 1 h, then treated with OSM (10 ng/ml) for 4 h. Total mRNA was collected and analyzed for TNF-α and iNOS gene expression by RT-PCR. Representative of 3 independent experiments. C, D. Primary microglia were pre-treated with 0.1% DMSO, 0.1 μM BAY 11-7085, or 1 μM BAY 11-7085 for 1 h, then treated with OSM (10 ng/ml) for 4 h (C) or 72 h (D). Supernatants were collected and analyzed for TNF-α protein production by ELISA (C) or for nitrite production using the Griess reagent (D). Mean +/− S.D. of 2 independent experiments. * p-values < 0.05 were considered statistically significant.
Figure 4
Figure 4
OSM-induced TNF-α and iNOS partially requires the TNF-R1. A. Primary microglia from WT or TNF-R1−/− mice were analyzed for expression of TNF-R1 by immunoblotting. B. WT and TNF-R1−/− microglia were treated with OSM (10 ng/ml) for 4 h and mRNA was analyzed for expression of TNF-α (B) and iNOS (C) by quantitative RT-PCR. Threshold cycle values were used to calculate relative quantities (RQ), or fold induction, of each gene. Mean +/− S.D. of 2 independent experiments. D. WT and TNF-R1/− microglia were treated with OSM (10 ng/ml) for 4 h or 8 h and supernatants were analyzed for TNF-α protein expression by ELISA. TNF-α levels are expressed as a percentage of TNF-α levels in OSM-treated WT supernatants. Mean +/− S.D. of 3 independent experiments. E. WT and TNF-R1−/− microglia were treated with OSM (10 ng/ml) for the indicated times and analyzed for P-p65Ser276 and total p65 by immunoblotting. Representative of 2 independent experiments. * p-values < 0.05 were considered statistically significant.
Figure 5
Figure 5
OSM-induced release of TNF-α from microglia is neurotoxic. Primary microglia were incubated with media alone (UN) or with OSM (10 ng/ml) for 24 h. Four hundred μl of supernatant from each condition was added to primary cortical neuron cultures and incubated for 24 h at 37°C. Where indicated, supernatants were incubated with antibodies against TNF-α or total mouse IgG for 2 h at 37°C before being added to neurons. After 24 h, neuronal viability was assessed using the MTT Reagent. Absorbance values of each sample were measured in duplicate at 570 nm. Cell viability readings of neurons incubated with supernatants from media alone-treated microglia were set to 100%. Results show the average % cell viability for each condition +/− S.D. from 2 independent experiments. * p-values < 0.05 were considered statistically significant.
Figure 6
Figure 6
IL-27 inhibits OSM-induced TNF-α and iNOS expression and partially rescues neuronal cell death. A. Primary microglia were incubated in media alone, OSM (10 ng/ml) for 4 h, IL-27 (5 ng/ml) for 8 h, or pre-treated with IL-27 for 4 h, then exposed to OSM for an additional 4 h. Total mRNA was harvested and analyzed for TNF-α and iNOS gene expression by RT-PCR. GAPDH was included as a control. Values for the first lane (untreated condition) were set to 1 and fold induction for treatment conditions were determined by dividing each treatment value by the untreated value. Representative of 3 independent experiments. B. BV2 microglia were incubated in media alone, treated with OSM (10 ng/ml) for 4 h, or pre-treated with IL-27 (5 ng/ml) for 4, 2, or 0 h (co-treatment), then treated with OSM for an additional 4 h. Total mRNA was harvested and analyzed for TNF-α and iNOS gene expression by RT-PCR. Fold induction was calculated as in A. Representative of 3 independent experiments. C. BV2 cells were incubated in media alone, treated with OSM (10 ng/ml) for 4 h, or pre-treated with increasing concentrations (1, 5, 10 or 20 ng/ml) of IL-27 for 4 h, then treated with OSM for an additional 4 h. Total mRNA was harvested and analyzed for TNF-α and iNOS gene expression by RT-PCR. Fold induction was calculated as in A. Representative of 3 independent experiments. D, E. Primary microglia were pre-treated with IL-27 (5 ng/ml) for 4 h, followed by treatment with OSM (10 ng/ml) for 24 h (D) or 72 h (E). Supernatants were collected and analyzed for TNF-α protein (D) or nitrite production (E). Graphs in D and E show the average % inhibition in TNF-α and nitrite production +/−S.D., respectively, from 3 independent experiments. F. Primary microglia were incubated in 1% DMEM alone (UN), treated with OSM (10 ng/ml) for 24 h (OSM), treated with IL-27 (5 ng/ml) for 24 h (IL-27), or pre-treated with IL-27 for 4 h, and then treated with OSM for an additional 24 h (IL-27 + OSM). Four hundred μl of supernatant from each condition was added to primary cortical neuron cultures and incubated for 24 h. Neuronal viability was then assessed using the MTT Reagent. Absorbance values of each sample were measured in duplicate at 570 nm. Cell viability readings of neurons incubated with supernatants from media alone-treated microglia were set to 100%. Results show the average % cell viability for each condition +/− S.D., from 2 independent experiments. * p-values < 0.05 were considered statistically significant.
Figure 7
Figure 7
IL-27 inhibits OSM-mediated p65 activation and recruitment to the TNF-α and iNOS promoters. A. BV2 microglial cells were treated with media alone, OSM (10 ng/ml) for 0.25 h, IL-27 (5 ng/ml) for 4.25 h, or pre-treated with IL-27 for 4 h and then treated with OSM for 0.25 h. Protein lysates were collected and analyzed for P-p65Ser536 and total p65 by immunoblotting. Representative of 2 independent experiments. B. BV2 cells were treated with media alone, OSM (10 ng/ml) for 2 h, IL-27 (5 ng/ml) for 6 h, or pre-treated with IL-27 for 4 h and then treated with OSM for 2 h. The ChIP assay was performed to assess binding of P-p65 Ser536, total p65, AcH3, p300 and HDAC1 to NF-κB sites within the TNF-α and iNOS promoters. Total IgG shows no non-specific binding. Input serves as a control for total DNA levels.
Figure 8
Figure 8
Model of OSM-mediated expression of TNF-α and iNOS in microglia: Regulation by IL-27. OSM induces activation of NF-κB p65, which activates TNF-α and iNOS transcription. TNF-α protein is then translated, released, and signals through the TNF-R1 to sustain NF-κB p65 activation, contributing to subsequent TNF-α and iNOS gene expression. OSM-induced secretion of soluble factors, including TNF-α and possibly iNOS, induce neuron cell death. In the presence of IL-27, OSM-induced NF-κB p65 activation and recruitment to the TNF-α and iNOS promoters is reduced. Also, the presence of p300 at these promoters is replaced by HDAC1. Together, this leads to diminished expression of TNF-α and iNOS and protection against neurotoxicity.

References

    1. Aggarwal BB. Signalling pathways of the TNF superfamily: a double-edged sword. Nat Rev Immunol. 2003;3(9):745–56. - PubMed
    1. Allan SM, Rothwell NJ. Cytokines and acute neurodegeneration. Nat Rev Neurosci. 2001;2(10):734–44. - PubMed
    1. Arnett HA, Mason J, Marino M, Suzuki K, Matsushima GK, Ting JP. TNF alpha promotes proliferation of oligodendrocyte progenitors and remyelination. Nat Neurosci. 2001;4(11):1116–22. - PubMed
    1. Ashburner BP, Westerheide SD, Baldwin AS., Jr The p65 (RelA) subunit of NF-kappaB interacts with the histone deacetylase (HDAC) corepressors HDAC1 and HDAC2 to negatively regulate gene expression. Mol Cell Biol. 2001;21(20):7065–77. - PMC - PubMed
    1. Atkinson GP, Nozell SE, Harrison DK, Stonecypher MS, Chen D, Benveniste EN. The prolyl isomerase Pin1 regulates the NF-kappaB signaling pathway and interleukin-8 expression in glioblastoma. Oncogene. 2009;28(42):3735–45. - PMC - PubMed

Publication types

MeSH terms