

Biological and molecular mechanisms of sulfur mustard analogue-induced toxicity in JB6 and HaCaT cells: possible role of ataxia telangiectasia-mutated/ataxia telangiectasia-Rad3-related cell cycle checkpoint pathway
- PMID: 20469912
- PMCID: PMC2891139
- DOI: 10.1021/tx100038b
Biological and molecular mechanisms of sulfur mustard analogue-induced toxicity in JB6 and HaCaT cells: possible role of ataxia telangiectasia-mutated/ataxia telangiectasia-Rad3-related cell cycle checkpoint pathway
Abstract
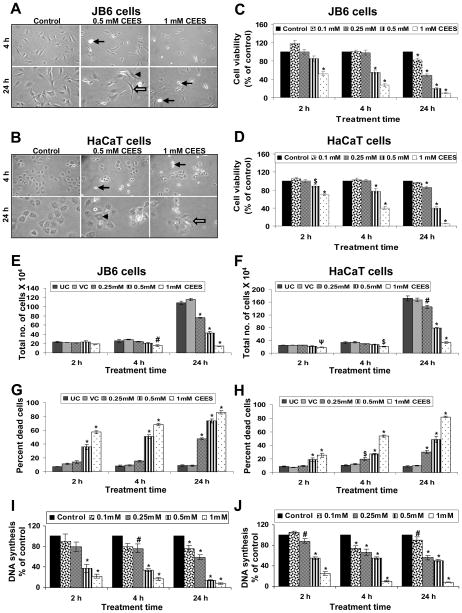
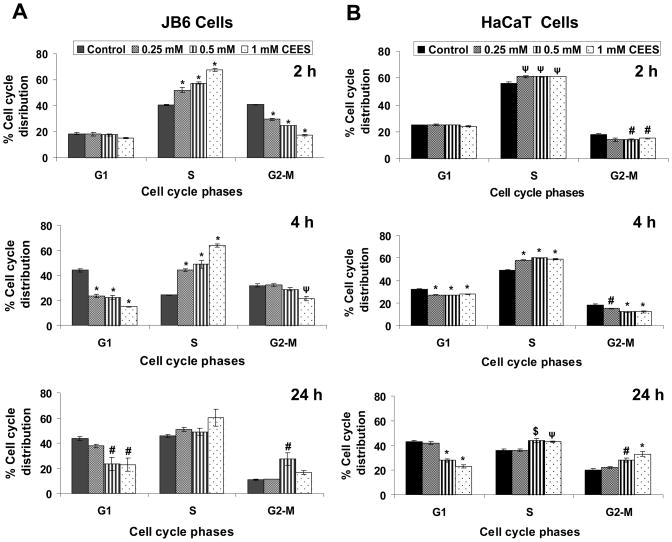
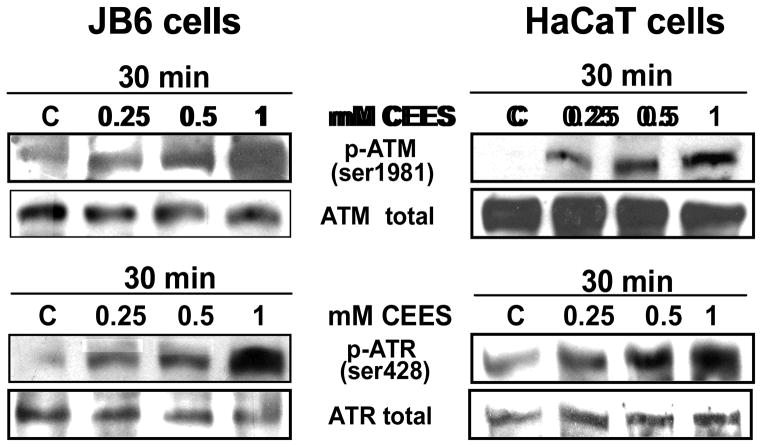
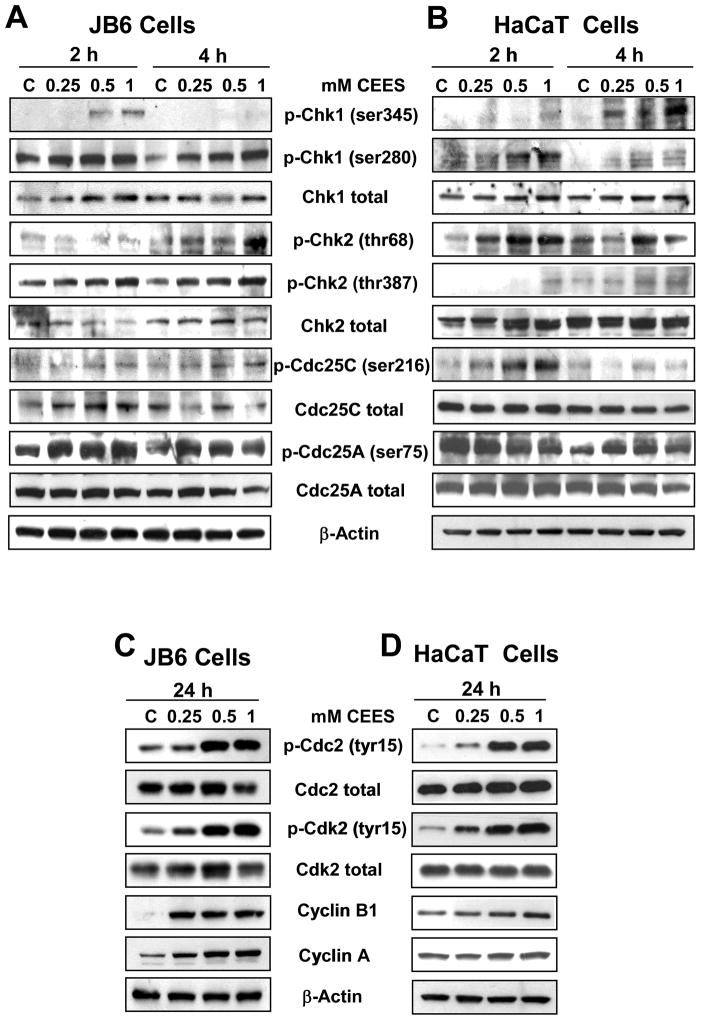
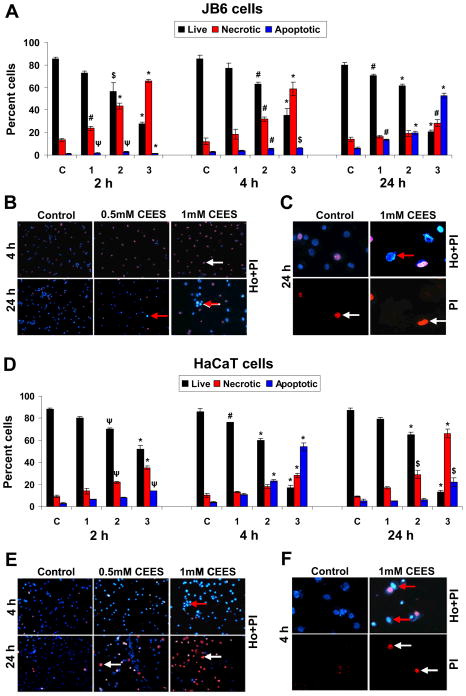
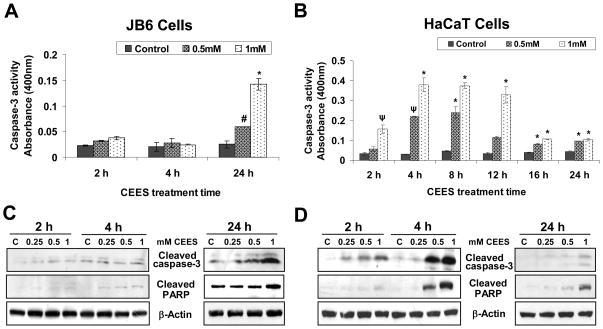
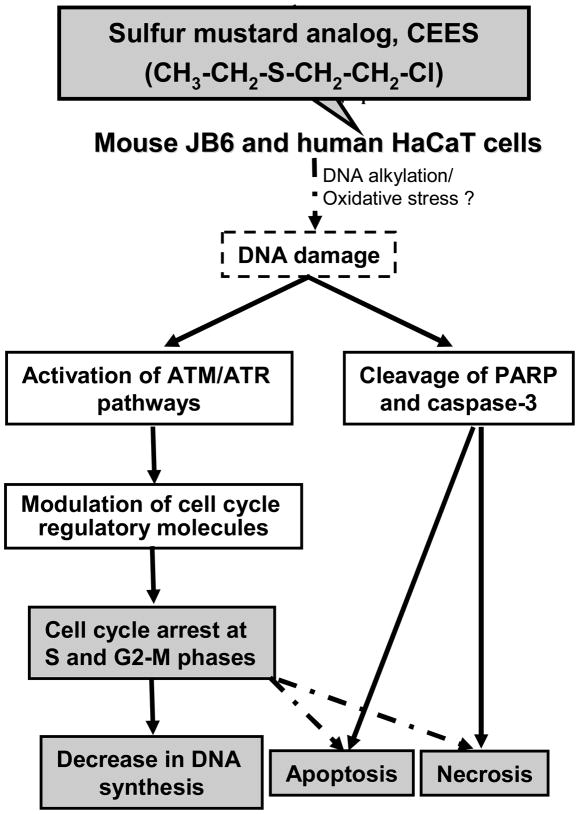
Effective medical treatment and preventive measures for chemical warfare agent sulfur mustard (HD)-caused incapacitating skin toxicity are lacking, because of limited knowledge of its mechanism of action. The proliferating basal epidermal cells are primary major sites of attack during HD-caused skin injury. Therefore, employing mouse JB6 and human HaCaT epidermal cells, here, we investigated the molecular mechanism of HD analogue 2-chloroethyl ethyl sulfide (CEES)-induced skin cytotoxicity. As compared to the control, up to 1 mM CEES treatment of these cells for 2, 4, and 24 h caused dose-dependent decreases in cell viability and proliferation as measured by DNA synthesis, together with S and G2-M phase arrest in cell cycle progression. Mechanistic studies showed phosphorylation of DNA damage sensors and checkpoint kinases, ataxia telangiectasia-mutated (ATM) at ser1981 and ataxia telangiectasia-Rad3-related (ATR) at ser428 within 30 min of CEES exposure, and modulation of S and G2-M phase-associated cell cycle regulatory proteins, which are downstream targets of ATM and ATR kinases. Hoechst-propidium iodide staining demonstrated that CEES-induced cell death was both necrotic and apoptotic in nature, and the latter was induced at 4 and 24 h of CEES treatment in HaCaT and JB6 cells, respectively. An increase in caspase-3 activity and both caspase-3 and poly(ADP-ribose)polymerase (PARP) cleavage coinciding with CEES-caused apoptosis in both cell lines suggested the involvement of the caspase pathway. Together, our findings suggest a DNA-damaging effect of CEES that activates ATM/ATR cell cycle checkpoint signaling as well as caspase-PARP pathways, leading to cell cycle arrest and apoptosis/necrosis in both JB6 and HaCaT cells. The identified molecular targets, quantitative biomarkers, and epidermal cell models in this study have the potential and usefulness in rapid development of effective prophylactic and therapeutic interventions against HD-induced skin toxicity.
Figures
Similar articles
-
Catalytic antioxidant AEOL 10150 treatment ameliorates sulfur mustard analog 2-chloroethyl ethyl sulfide-associated cutaneous toxic effects.Free Radic Biol Med. 2014 Jul;72:285-95. doi: 10.1016/j.freeradbiomed.2014.04.022. Epub 2014 May 9. Free Radic Biol Med. 2014. PMID: 24815113 Free PMC article.
-
Efficacy of glutathione in ameliorating sulfur mustard analog-induced toxicity in cultured skin epidermal cells and in SKH-1 mouse skin in vivo.J Pharmacol Exp Ther. 2011 Feb;336(2):450-9. doi: 10.1124/jpet.110.173708. Epub 2010 Oct 25. J Pharmacol Exp Ther. 2011. PMID: 20974699 Free PMC article. Review.
-
Involvement of the ATR- and ATM-dependent checkpoint responses in cell cycle arrest evoked by pierisin-1.Mol Cancer Res. 2006 Feb;4(2):125-33. doi: 10.1158/1541-7786.MCR-05-0104. Mol Cancer Res. 2006. PMID: 16513843
-
Sulfur and nitrogen mustards induce characteristic poly(ADP-ribosyl)ation responses in HaCaT keratinocytes with distinctive cellular consequences.Toxicol Lett. 2016 Feb 26;244:56-71. doi: 10.1016/j.toxlet.2015.09.010. Epub 2015 Sep 14. Toxicol Lett. 2016. PMID: 26383629
-
Exploiting synthetic lethal interactions for targeted cancer therapy.Cell Cycle. 2009 Oct 1;8(19):3112-9. doi: 10.4161/cc.8.19.9626. Cell Cycle. 2009. PMID: 19755856 Free PMC article. Review.
Cited by
-
Myeloperoxidase deficiency attenuates nitrogen mustard-induced skin injuries.Toxicology. 2014 Jun 5;320:25-33. doi: 10.1016/j.tox.2014.02.013. Epub 2014 Mar 12. Toxicology. 2014. PMID: 24631667 Free PMC article.
-
2-Chloroethyl ethyl sulfide causes microvesication and inflammation-related histopathological changes in male hairless mouse skin.Toxicology. 2011 Apr 11;282(3):129-38. doi: 10.1016/j.tox.2011.01.021. Epub 2011 Feb 2. Toxicology. 2011. PMID: 21295104 Free PMC article.
-
MG53 Mitigates Nitrogen Mustard-Induced Skin Injury.Cells. 2023 Jul 23;12(14):1915. doi: 10.3390/cells12141915. Cells. 2023. PMID: 37508578 Free PMC article.
-
Catalytic antioxidant AEOL 10150 treatment ameliorates sulfur mustard analog 2-chloroethyl ethyl sulfide-associated cutaneous toxic effects.Free Radic Biol Med. 2014 Jul;72:285-95. doi: 10.1016/j.freeradbiomed.2014.04.022. Epub 2014 May 9. Free Radic Biol Med. 2014. PMID: 24815113 Free PMC article.
-
miR-34a in extracellular vesicles from bone marrow mesenchymal stem cells reduces rheumatoid arthritis inflammation via the cyclin I/ATM/ATR/p53 axis.J Cell Mol Med. 2021 Feb;25(4):1896-1910. doi: 10.1111/jcmm.15857. Epub 2021 Jan 19. J Cell Mol Med. 2021. PMID: 33465281 Free PMC article.
References
-
- Noort D, Benschop HP, Black RM. Biomonitoring of exposure to chemical warfare agents: a review. Toxicol Appl Pharmacol. 2002;184:116–126. - PubMed
-
- Saladi RN, Smith E, Persaud AN. Mustard: a potential agent of chemical warfare and terrorism. Clin Exp Dermatol. 2006;31:1–5. - PubMed
-
- Kehe K, Szinicz L. Medical aspects of sulphur mustard poisoning. Toxicology. 2005;214:198–209. - PubMed
Publication types
MeSH terms
Substances
Grants and funding
LinkOut - more resources
Full Text Sources
Other Literature Sources
Research Materials
Miscellaneous
