. 2010 Jun 15;49(23):4766-78.
doi: 10.1021/bi100020e.

Protein kinase C epsilon regulation of translocator protein (18 kDa) Tspo gene expression is mediated through a MAPK pathway targeting STAT3 and c-Jun transcription factors

Affiliations

Protein kinase C epsilon regulation of translocator protein (18 kDa) Tspo gene expression is mediated through a MAPK pathway targeting STAT3 and c-Jun transcription factors

Amani Batarseh et al. Biochemistry. .

Abstract

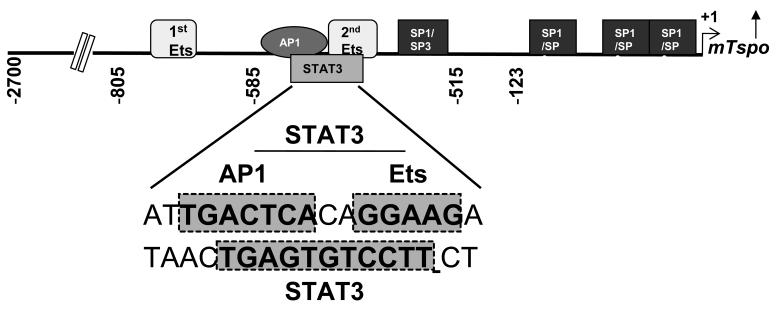
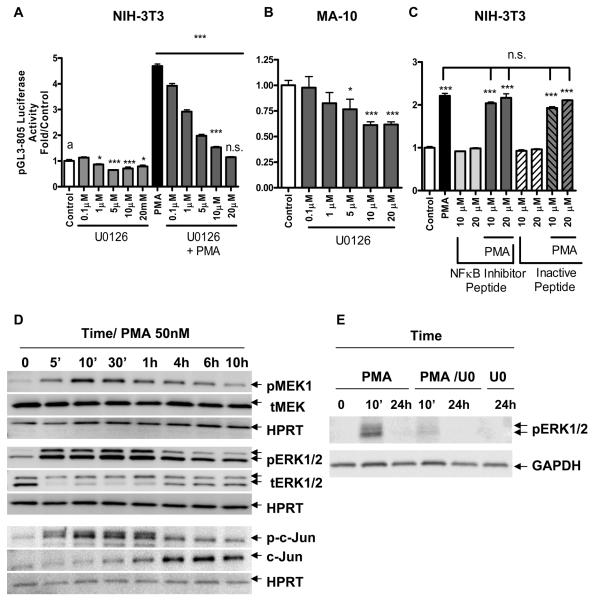
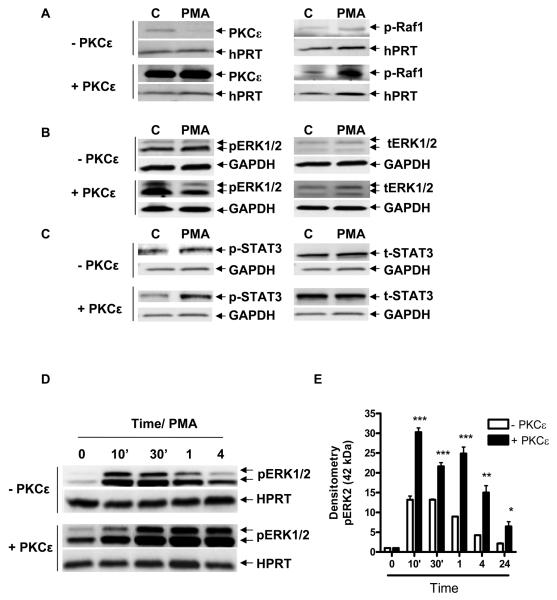
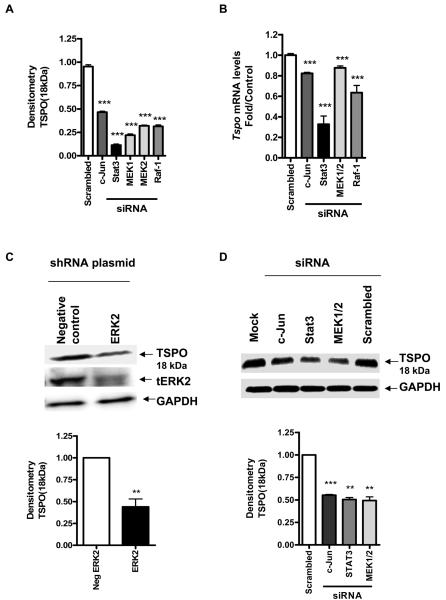
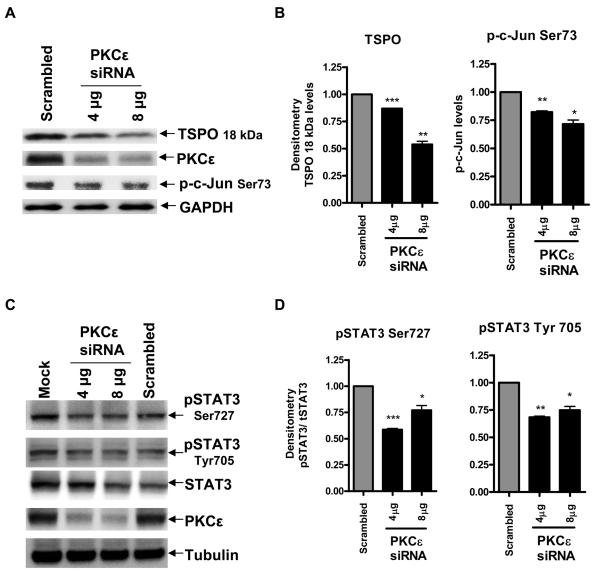
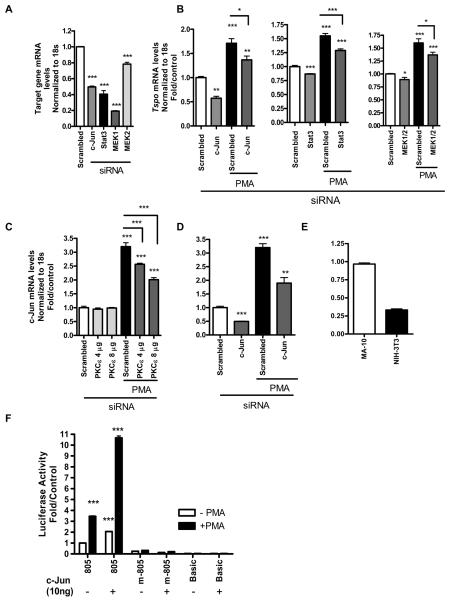
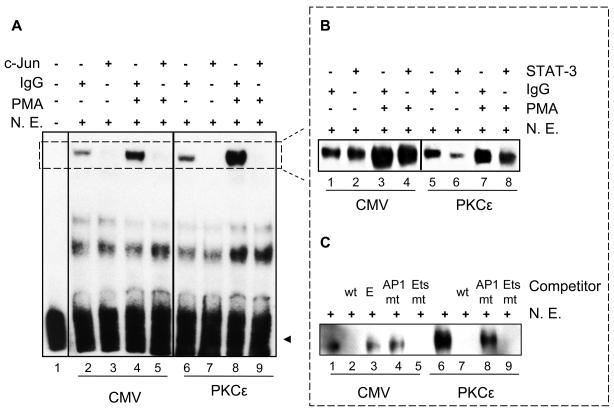
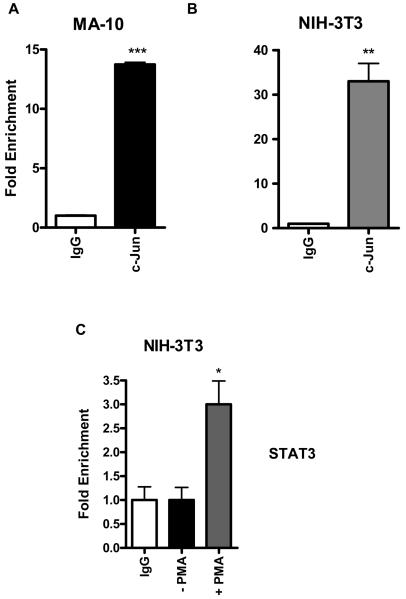
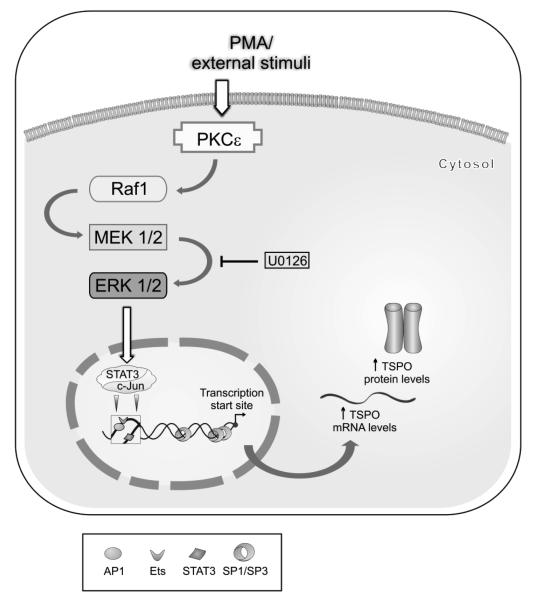
Translocator protein TSPO is an 18 kDa protein implicated in numerous cell functions and is highly expressed in secretory and glandular tissues, especially in steroidogenic cells. TSPO expression is altered in pathological conditions such as certain cancers and neurological diseases. In search of the factors regulating Tspo expression, we recently showed that high levels of TSPO in steroidogenic cells may be due to high constitutive expression of protein kinase Cepsilon (PKCepsilon), while phorbol 12-myristate 13-acetate (PMA) activation of PKCepsilon drives inducible TSPO expression in nonsteroidogenic cells, likely through activator protein 1 (AP1). In this study, we aimed to identify the signal transduction pathway through which PKCepsilon regulates Tspo gene expression. The MEK1/2 specific inhibitor U0126, but not NFkappaB inhibitors, reduced basal Tspo promoter activity in TSPO-rich steroidogenic cells (MA-10 Leydig), as well as basal and PMA-induced Tspo promoter levels in TSPO-poor nonsteroidogenic cells (NIH-3T3 fibroblasts). AP1 and signal transducer and activation of transcription 3 (STAT3) have binding sites in the Tspo promoter and are downstream targets of PKCepsilon and MAPK (Raf-1-ERK1/2) pathways. PKCepsilon overexpression induced STAT3 phosphorylation in NIH-3T3 cells, while PKCepsilon knockdown reduced STAT3 and c-Jun phosphorylation in Leydig cells. MEK1/2, ERK2, c-Jun, and STAT3 knockdown reduced Tspo mRNA and protein levels in Leydig cells. Additionally, Raf-1 reduced Tspo mRNA levels in the same cells. MEK1/2, c-Jun, and STAT3 knockdown also reduced basal as well as PMA-induced Tspo mRNA levels in NIH-3T3 cells. Together, these results demonstrate that PKCepsilon regulates Tspo gene expression through a MAPK (Raf-1-MEK1/2-ERK1/2) signal transduction pathway, acting at least in part through c-Jun and STAT3 transcription factors.


Figures

Figure 1
Figure 1. Promoter regions 805-515 and 123-1 harbor elements essential for basal Tspo promoter activity in MA-10 and NIH-3T3 cells
Schematic representation of the mouse Tspo promoter showing transcription factor binding sites important for activity. The sequence harboring AP1, Ets and an overlapping STAT3 site is magnified. Shaded boxes indicate the nucleotide sequences of transcription factor binding sites.
Figure 2
Figure 2. PMA-induced activation of the Tspo promoter is mediated by a MAPK pathway
(A) Dose-dependent effect of U0126 on pGL3-805 luciferase activity, alone or with PMA (50 nM) or DMSO (control) in NIH-3T3 cells. (B) Dose-dependent effect of U0126 on pGL3-805 luciferase activity in MA-10 cells. (C) Dose-dependent effect of NFκB inhibitor peptide or its inactive peptide incubated in the presence or absence of PMA (50 nM) on NIH-3T3 cells. Cells were transfected with pGL3-805 for 24 h previous to treating with PMA. Cells were preincubated with the indicated concentrations of inhibitors or vehicle for 1 h prior to adding PMA up to 24 h after which they were lysed and luciferase activity was measured (D) Immunoblot of phosphorylated (p) and total (t) levels of MEK1, ERK1/2, and c-Jun in NIH-3T3 cells treated with or without PMA (50 nM) for the indicated time course. (E) Effect of U0126 (UO) on PMA-induced ERK1/2 phosphorylation. Cells were seeded for 24 h previous to treatment with PMA for the indicated time points. When treated with U0126 inhibitor, cells were preincubated for 1 h before addition of PMA. Blots shown are representative of at least two independent experiments. Results in (A), (B), and (C) are derived from three independent experiments (n = 9) and presented as fold over untreated control. *p < 0.05 and ***p < 0.001 vs. control; ns, non-significant.
Figure 3
Figure 3. PKCε affects Raf-1, ERK1/2 and STAT3 phosphorylation and prolongs and maximizes activation of the ERK1/2 pathway
NIH-3T3 cells were transfected with the PKCε expression vector or empty CMV vector for 24 h, then treated with or without PMA for 24 h and examined by immunoblot for the effect on p-Raf-1 (A), pERK1/2 (B), and p-STAT3 Tyr705 (C). (D) Immunoblot analysis of pERK1/2 levels in NIH-3T3 cells treated with PMA and overexpressing the PKCε expression vector or empty CMV vector for the indicated times. (E) Densitometry of the data shown in (D), obtained from three independent experiments. In (E), immunoreactive bands were normalized to HPRT, and are expressed as an increase relative to control, (CMV samples were normalized to CMV at time zero (white bars), and PKCε samples were normalized to PKCε time zero (black bars). *p < 0.05, **p < 0.01, and ***p < 0.001 vs. control. Data are representative of at least three independent experiments.
Figure 4
Figure 4. Raf-1, MEK1/2, Stat3, and c-Jun siRNA and ERK2 shRNA significantly reduce TSPO expression levels in MA-10 cells
(A) Effect of gene-specific siRNA treatment on c-Jun, Stat3, and MEK1/2, Raf-1 mRNA levels compared to control (scrambled siRNA). (B) Effect of down-regulation of c-Jun, Stat3, and MEK1/2, Raf-1 on Tspo mRNA levels compared to control cells incubated with scrambled siRNA. (C) Effect of down-regulation of ERK2 by shRNA on TSPO protein levels (top panel) and densitometric analysis of the immunoreactive bands (bottom panel). Cells were transfected with shRNA for ERK2 or pKD-negative control for 72 h before immunoblot analysis. (D) Effect of down-regulation of MEK1/2, Stat3, and c-Jun by siRNA on TSPO protein levels (top panel) and densitometric analysis of the immunoreactive bands (bottom panel). Cells were treated with the siRNA pool specific for c-Jun, Stat3, and MEK1/2, Raf-1 or scrambled oligonucleotides as described under materials and methods before analysis of Tspo levels using QRT-PCR and immunoblotting. Immunoreactive bands were normalized to GAPDH, and values are expressed as a decrease relative to controls incubated with scrambled siRNA. Immunoblots are representative of at least three independent experiments. Data in (A) were normalized to control (scrambled siRNA) and are derived from three independent experiments (n = 9) **p < 0.01, and ***p < 0.001 vs. control.
Figure 5
Figure 5. PKCε mediates TSPO protein levels and regulates c-Jun and STAT3 activity in MA-10 cells
Effect of PKCε knockdown on TSPO expression, phosphorylation levels of c-Jun at Ser73 and STAT3 at Ser727 and Tyr705. Cells were seeded and treated with the siRNA pool specific for PKCε, or with scrambled siRNA as mentioned in materials and methods. Cells were analyzed for PKCε, c-Jun pSer73 (A), STATpSer727, STATpTyr705, and STAT3 by immunoblotting 96 h after siRNA transfection (C). Densitometric analysis of the blots was performed and immunoreactive bands were normalized to GAPDH (B) or Tubulin (D) controls, and data are expressed as decrease relative to control. Immunoblots are representative of at least two independent experiments. *p < 0.05, **p < 0.01, and ***p < 0.001 vs. control.
Figure 6
Figure 6. MEK1/2, STAT3, and c-Jun mediate the effect of PMA on Tspo mRNA levels in NIH-3T3 cells
(A) MEK1/2, Stat3, and c-Jun mRNA knockdown levels following treatment with gene-specific siRNAs compared to scrambled siRNA as described in materials and methods. (B) Effect of down-regulation of MEK1/2, Stat3, and c-Jun on Tspo mRNA levels in NIH-3T3 cells on Tspo mRNA levels. Cells were treated with the siRNA pool specific for MEK and Stat3 for 48 h or c-Jun for 48 h, where new siRNA was added at 24 h after the first transfection, followed by treatment with PMA for an additional 24 h. For control, cells were treated with scrambled siRNA for 48 h before treatment with PMA (50 nM) for an additional 24 h. Cells were then harvested and RNA was extracted and used for QRT-PCR analysis. (C) Effect of PKCε siRNA on newly synthesized c-Jun mRNA levels induced by PMA. (D) PMA induces c-Jun mRNA levels in NIH-3T3 cells, an effect reduced by c-Jun siRNA. (E) A comparative representation of c-Jun mRNA levels in MA-10 cells vs. NIH-3T3 cells. (F) Effect of overexpressing c-Jun on Tspo pGL3-805 or pGL3-m805 (harboring mutated AP1 and Ets sites) promoter constructs in NIH-3T3 cells. NIH-3T3 cells were seeded for 24 h prior to transfecting with either 10ng pCMV6-c-Jun or empty pCMV6 vector along with Tspo promoter constructs or basic as a control for an additional 24 h. Cells were then treated with 50 nM PMA for 24 h and luciferase activity was measured. Data were normalized to control (incubation with scrambled siRNA) and are derived from three independent experiments (n = 9). *p < 0.05, **p < 0.01 and ***p < 0.001 vs. control.
Figure 7
Figure 7. PMA induces c-Jun and STAT3 binding to their putative binding sites on the Tspo promoter
EMSA of biotinylated AP1 oligonucleotide incubated without (A, lane 1) or with NIH-3T3 nuclear extract (N.E.) (all other lanes). EMSAs were performed on nuclear extracts from NIH-3T3 cells transfected with CMV and treated without (A, lanes 2, 3, 6 and 7) and with PMA (lanes 4, 5, 8 and 9). Supershift/immunodepletion binding reactions were performed in the presence of IgG (A, lanes 2, 4, 6 and 8) or c-Jun antibody (A, lanes 3, 5, 7 and 9). Small dotted box in (A) indicates specific DNA-protein complexes. Dotted box on the right indicates the same specific DNA-protein complexes formed under different conditions. In (B) EMSAs were performed on nuclear extracts from NIH-3T3 cells transfected with CMV (B, lanes 1-4) or PKCε (B, lanes 5-8) and treated without (B, lanes 1, 2, 5 and 6) and with PMA (lanes 3, 4, 7 and 8). Supershift/immunodepletion binding reactions were performed in the presence of IgG (B, lanes 1, 3, 5 and 7) or STAT3 antibody (B, lanes 2, 4, 6 and 8). Competition experiments were performed using nuclear extracts from NIH-3T3 cells transfected with CMV (C, lanes 1-5) or PKCε (C, lanes 6-9). Nuclear extracts were incubated with unlabeled AP1 oligonucleotide (wt) (C, lanes 2 & 7), AP1 mutant oligonucleotide (AP1 mut) (C, lanes 4 & 8), Ets mutant oligonucleotide (Ets mut) (C, lanes 5 & 9), or unrelated oligonucleotide (E) (C, lane 3). The free probe is indicated with an arrowhead. DNA-protein binding was optimized by including 10 μg BSA and 4 mM DTT in the all reactions. Results shown are representative of three independent experiments.
Figure 8
Figure 8. c-Jun is bound to the endogenous Tspo promoter in intact MA-10, and PMA recruits STAT3 binding in NIH/3T3 cells
DNA from MA-10 and NIH/3T3 cells was precipitated with antibodies specific for c-Jun (A & B) by ChIP analysis under basal conditions. NIH-3T3 cells were treated with or without 50 nM PMA for 24 h and DNA was precipitated with STAT3 specific antibodies (C) by ChIP analysis as described in materials and methods. DNA was amplified by QRT-PCR using primers specific for the distal area of the Tspo promoter spanning the binding sites for AP1, Ets and STAT3 shown in Figure 1. Normal rabbit IgG served as a negative control. Data are presented as fold enrichment of the ChIP antibody signal versus the negative control IgG using the ddCT method, and are derived from three independent experiments (n = 9). *p < 0.05, **p < 0.01 and ***p < 0.001.
Figure 9
Figure 9. PKCε acts on the Tspo promoter through a MAPK (Raf-1 -ERK1/2) pathway and STAT3 and c-Jun transcription factors
STAT3 has a binding site on the complimentary strand spanning the AP1 (a c-Jun binding site) and Ets binding sites.

References

    1. Casellas P, Galiegue S, Basile AS. Peripheral benzodiazepine receptors and mitochondrial function. Neurochem. Int. 2002;40:475–486. - PubMed
    1. Papadopoulos V, Baraldi M, Guilarte TR, Knudsen TB, Lacapere JJ, Lindemann P, Norenberg MD, Nutt D, Weizman A, Zhang MR, Gavish M. Translocator protein (18kDa): new nomenclature for the peripheral-type benzodiazepine receptor based on its structure and molecular function. Trends Pharmacol. Sci. 2006;27:402–409. - PubMed
    1. Braestrup C, Squires RF. Specific benzodiazepine receptors in rat brain characterized by high-affinity (3H)diazepam binding. Proc. Natl. Acad. Sci. U. S. A. 1977;74:3805–3809. - PMC - PubMed
    1. Gavish M, Bachman I, Shoukrun R, Katz Y, Veenman L, Weisinger G, Weizman A. Enigma of the peripheral benzodiazepine receptor. Pharmacol. Rev. 1999;51:629–650. - PubMed
    1. Giatzakis C, Papadopoulos V. Differential utilization of the promoter of peripheral-type benzodiazepine receptor by steroidogenic versus nonsteroidogenic cell lines and the role of Sp1 and Sp3 in the regulation of basal activity. Endocrinology. 2004;145:1113–1123. - PubMed

Publication types

MeSH terms