. 2010;12(3):R86.
doi: 10.1186/ar3013. Epub 2010 May 14.

Plasma and synovial fluid microRNAs as potential biomarkers of rheumatoid arthritis and osteoarthritis

Affiliations

Plasma and synovial fluid microRNAs as potential biomarkers of rheumatoid arthritis and osteoarthritis

Koichi Murata et al. Arthritis Res Ther. 2010.

Abstract

Introduction: MicroRNAs (miRNAs), endogenous small noncoding RNAs regulating the activities of target mRNAs and cellular processes, are present in human plasma in a stable form. In this study, we investigated whether miRNAs are also stably present in synovial fluids and whether plasma and synovial fluid miRNAs could be biomarkers of rheumatoid arthritis (RA) and osteoarthritis (OA).

Methods: We measured concentrations of miR-16, miR-132, miR-146a, miR-155 and miR-223 in synovial fluid from patients with RA and OA, and those in plasma from RA, OA and healthy controls (HCs) by quantitative reverse transcription-polymerase chain reaction. Furthermore, miRNAs in the conditioned medium of synovial tissues, monolayer fibroblast-like synoviocytes, and mononuclear cells were examined. Correlations between miRNAs and biomarkers or disease activities of RA were statistically examined.

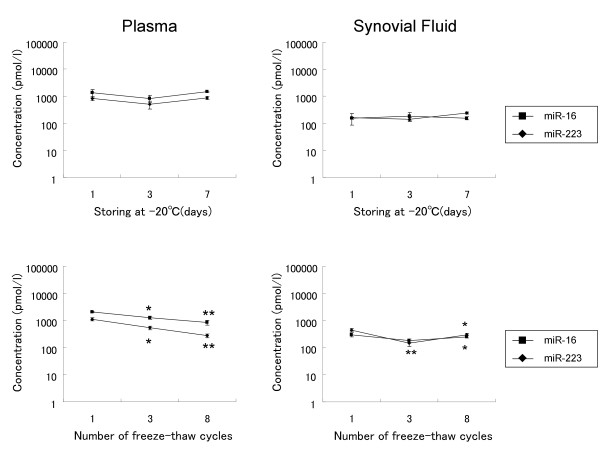
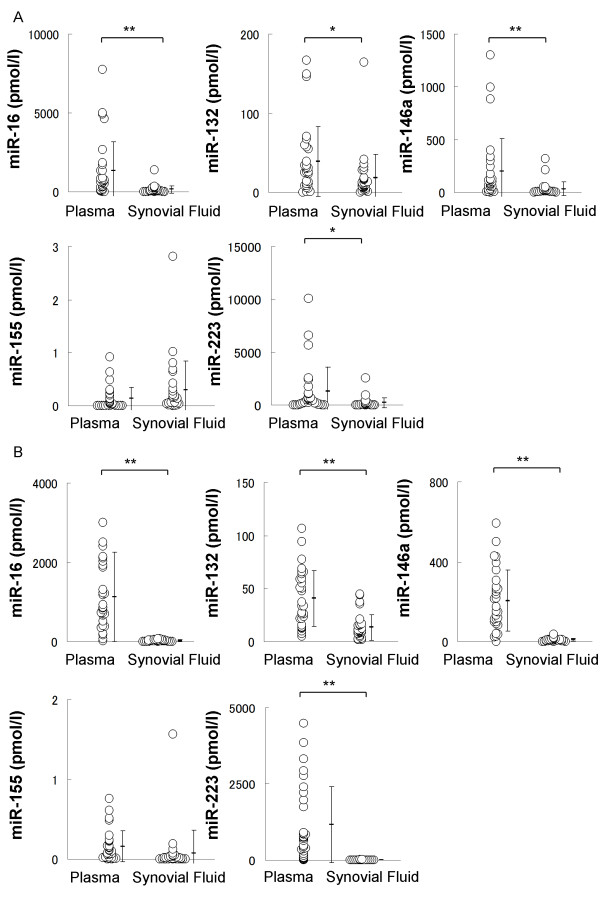
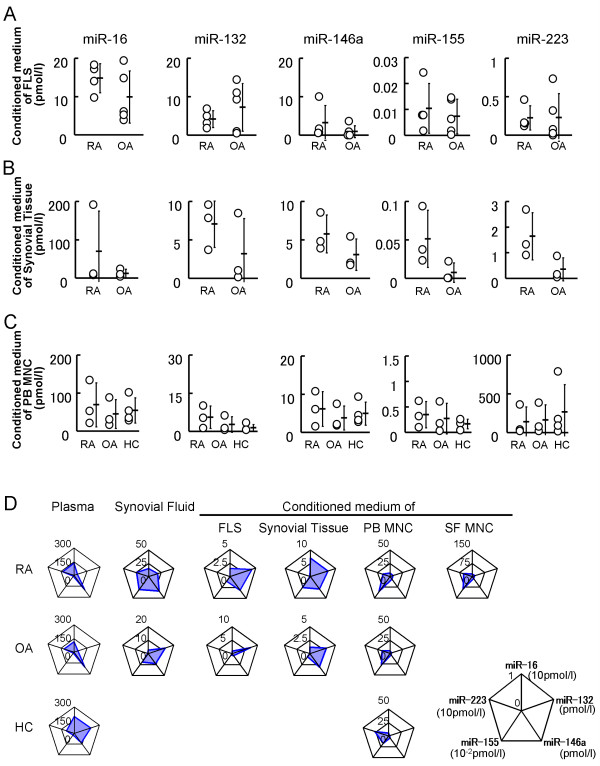
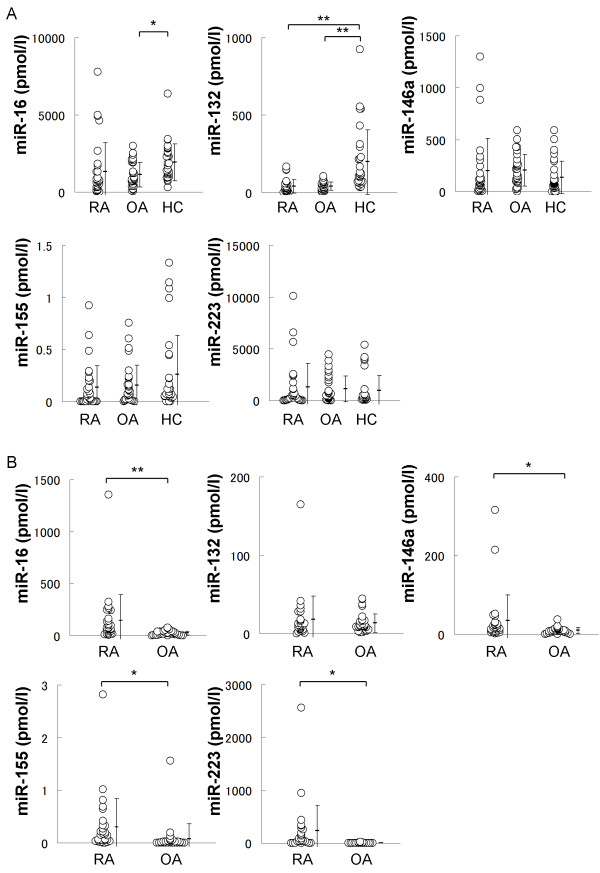
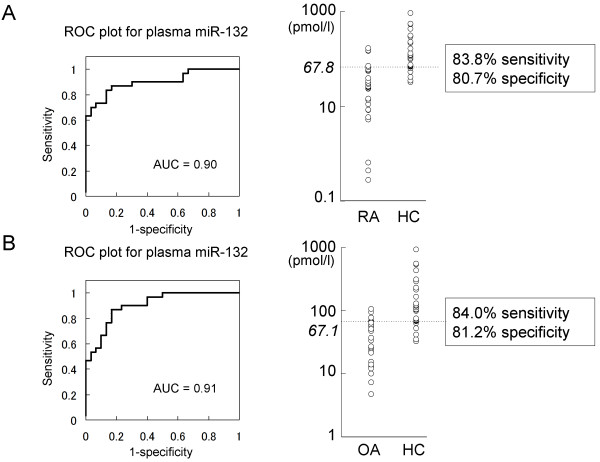
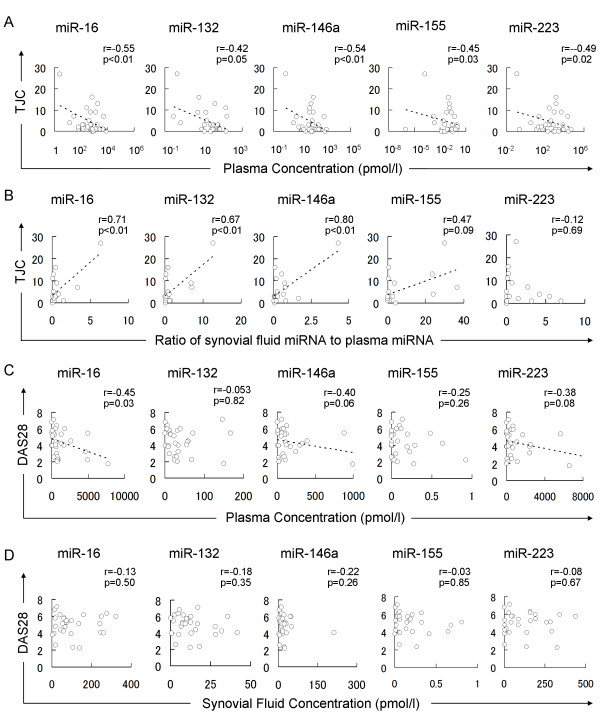
Results: Synovial fluid miRNAs were present and as stable as plasma miRNAs for storage at -20 degrees C and freeze-thawing from -20 degrees C to 4 degrees C. In RA and OA, synovial fluid concentrations of miR-16, miR-132, miR-146a, and miR-223 were significantly lower than their plasma concentrations, and there were no correlation between plasma and synovial fluid miRNAs. Interestingly, synovial tissues, fibroblast-like synoviocytes, and mononuclear cells secreted miRNAs in distinct patterns. The expression patterns of miRNAs in synovial fluid of OA were similar to miRNAs secreted by synovial tissues. Synovial fluid miRNAs of RA were likely to originate from synovial tissues and infiltrating cells. Plasma miR-132 of HC was significantly higher than that of RA or OA with high diagnosability. Synovial fluid concentrations of miR-16, miR-146a miR-155 and miR-223 of RA were significantly higher than those of OA. Plasma miRNAs or ratio of synovial fluid miRNAs to plasma miRNAs, including miR-16 and miR-146a, significantly correlated with tender joint counts and 28-joint Disease Activity Score.

Conclusions: Plasma miRNAs had distinct patterns from synovial fluid miRNAs, which appeared to originate from synovial tissue. Plasma miR-132 well differentiated HCs from patients with RA or OA, while synovial fluid miRNAs differentiated RA and OA. Furthermore, plasma miRNAs correlated with the disease activities of RA. Thus, synovial fluid and plasma miRNAs have potential as diagnostic biomarkers for RA and OA and as a tool for the analysis of their pathogenesis.


Figures

Figure 1
Figure 1
The presence of miRNAs in plasma and synovial fluid and their stability for storage. (Upper) Plasma and synovial fluid of RA were stored in --20°C until indicated days, thawed and analyzed for the concentrations of the indicated miRNAs. (Lower) The concentrations of indicated miRNAs in plasma and synovial fluid of RA after indicated freeze-thaw cycles from --20°C to 4°C. Significant differences compared to the concentration after the first freeze-thaw are indicated by * = P < 0.05, ** = P < 0.01. Results represent three independent experiments.
Figure 2
Figure 2
Comparisons between miRNA concentrations in plasma and those in synovial fluid. A and B, Plasma and synovial fluid concentrations of miR-16, miR-132, miR-146a, miR-155 and miR-223 in RA (A) and OA (B). The average concentrations of these miRNAs were quite different. Significant differences between plasma and synovial fluid are indicated by * = P < 0.05, ** = P < 0.01.
Figure 3
Figure 3
The concentrations of miRNAs in the condition medium of each cell or tissue of RA and OA. A, FLSs of RA (n = 4) and OA (n = 5) were cultured in serum-free medium for 48 h. Concentrations of miRNAs in each conditioned medium are shown. B, Synovial tissues of RA (n = 3) and OA (n = 3) were cultured in serum-free medium for 48 h. Concentrations of miRNAs in conditioned medium are shown. There were no statistically significant differences between RA and OA in A and B. C, PB MNCs of RA (n = 3), OA (n = 3) and HC (n = 3) were cultured in serum-free medium for 48 h. Concentrations of each miRNA in conditioned medium are shown. There were no statistically significant differences among RA, OA and HC. D, Radar charts show the average concentrations of each miRNA of each sample. Expression patterns of plasma miRNA of RA and OA were similar. Synovial fluid miRNAs were similar to the miRNAs secreted by synovial tissues.
Figure 4
Figure 4
The concentrations of plasma and synovial fluid miRNAs in RA and OA. A. Plasma concentrations of miR-16, miR-132, miR-146a, miR-155 and miR-223 in RA, OA and HC. The plasma concentration of miR-16 in OA was significantly lower than HC. The plasma concentrations of miR-132 in RA and OA were significantly lower than HC. B. Synovial fluid concentrations of indicated miRNAs in RA and OA. The concentrations of miR-16, miR-146a miR-155, miR-223 in RA were significantly higher than those in OA. Significant differences are indicated by * = P < 0.05, ** = P < 0.01.
Figure 5
Figure 5
ROC curve analysis of plasma miR-132 to differentiate patients with RA or OA from HCs. A. ROC plot of plasma miR-132 for the diagnosis of RA. AUC was 0.90. A cutoff value of 67.8 pmol/l diagnosed RA at the sensitivity of 83.8% and the specificity of 80.7%. B. ROC plot of plasma miR-132 for the diagnosis of OA. AUC was 0.91. A cutoff value of 67.1 pmol/l diagnosed OA at the sensitivity of 84.0% and the specificity of 81.2%.
Figure 6
Figure 6
Correlation between disease activities of RA and miRNAs in plasma or synovial fluid. TJC correlated with plasma miRNAs (A) or SF/PB ratio of miRNA (B). DAS28 correlated with plasma miRNAs (C), but not with synovial fluid miRNAs (D). r values of Pearson's product-moment correlation and P-values of their null hypothesis are shown. Regression lines are shown when P values are less than 0.1.

Comment in

References

    1. Ambros V. microRNAs: tiny regulators with great potential. Cell. 2001;107:823–826. doi: 10.1016/S0092-8674(01)00616-X. - DOI - PubMed
    1. Bartel DP. MicroRNAs: genomics, biogenesis, mechanism, and function. Cell. 2004;116:281–297. doi: 10.1016/S0092-8674(04)00045-5. - DOI - PubMed
    1. miRBase Realease 14. http://www.mirbase.org/
    1. Esau C, Davis S, Murray SF, Yu XX, Pandey SK, Pear M, Watts L, Booten SL, Graham M, McKay R, Subramaniam A, Propp S, Lollo BA, Freier S, Bennett CF, Bhanot S, Monia BP. miR-122 regulation of lipid metabolism revealed by in vivo antisense targeting. Cell Metab. 2006;3:87–98. doi: 10.1016/j.cmet.2006.01.005. - DOI - PubMed
    1. He L, He X, Lowe SW, Hannon GJ. microRNAs join the p53 network--another piece in the tumour-suppression puzzle. Nat Rev Cancer. 2007;7:819–822. doi: 10.1038/nrc2232. - DOI - PMC - PubMed

Publication types