. 2010 May 17:9:107.
doi: 10.1186/1476-4598-9-107.

Tasquinimod (ABR-215050), a quinoline-3-carboxamide anti-angiogenic agent, modulates the expression of thrombospondin-1 in human prostate tumors

Affiliations

Tasquinimod (ABR-215050), a quinoline-3-carboxamide anti-angiogenic agent, modulates the expression of thrombospondin-1 in human prostate tumors

Anders Olsson et al. Mol Cancer. .

Abstract

Background: The orally active quinoline-3-carboxamide tasquinimod [ABR-215050; CAS number 254964-60-8), which currently is in a phase II-clinical trial in patients against metastatic prostate cancer, exhibits anti-tumor activity via inhibition of tumor angiogenesis in human and rodent tumors. To further explore the mode of action of tasquinimod, in vitro and in vivo experiments with gene microarray analysis were performed using LNCaP prostate tumor cells. The array data were validated by real-time semiquantitative reversed transcriptase polymerase chain reaction (sqRT-PCR) and protein expression techniques.

Results: One of the most significant differentially expressed genes both in vitro and in vivo after exposure to tasquinimod, was thrombospondin-1 (TSP1). The up-regulation of TSP1 mRNA in LNCaP tumor cells both in vitro and in vivo correlated with an increased expression and extra cellular secretion of TSP1 protein. When nude mice bearing CWR-22RH human prostate tumors were treated with oral tasquinimod, there was a profound growth inhibition, associated with an up-regulation of TSP1 and a down- regulation of HIF-1 alpha protein, androgen receptor protein (AR) and glucose transporter-1 protein within the tumor tissue. Changes in TSP1 expression were paralleled by an anti-angiogenic response, as documented by decreased or unchanged tumor tissue levels of VEGF (a HIF-1 alpha down stream target) in the tumors from tasquinimod treated mice.

Conclusions: We conclude that tasquinimod-induced up-regulation of TSP1 is part of a mechanism involving down-regulation of HIF1alpha and VEGF, which in turn leads to reduced angiogenesis via inhibition of the "angiogenic switch", that could explain tasquinimods therapeutic potential.


Figures

Figure 1
Figure 1
Tasquinimod effects on gene expression in LNCaP cells analyzed with DNA microarray. Altered gene expression induced by tasquinimod in LNCaP cell cultures. (A) Data plot of observed M ((M) = log2(Int1/Int2)) versus A (average intensity) from in vitro microarray experiment averaged over biological replicates (n = 4). THBS1 (arrow), GDF15 and CYP1A1 were significant outliers in all arrays analyzed (FDR < 10%; Table 1). (B) Validation of microarray data with semi-qRT-PCR confirmed the up-regulation of THBS, GDF14 and CYP1A1 (red bars; Δcp of 2.32 equals to a 5-fold change in mRNA expression). Expressed data represents the mean ± SD of at least two independent experiments. (*) p ≤ 0.05 and (**) p ≤ 0.01 compared with untreated control (Student's t-test).
Figure 2
Figure 2
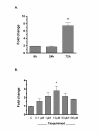
TSP1 mRNA induction by tasquinimod in in vitro tumor cell cultures. Tasquinimod-induced mRNA expression in LNCaP cells measured by real time semi-quantitative RT-PCR. (A) Time study after in vitro exposure with 10 μM tasquinimod, and (B) dose response with tasquinimod treatment between 0.1-100 μM for 72 h (p = 0.0128, ANOVA). Data expressed represents the mean ± SD of at least two independent experiments. (*) p ≤ 0.05 and (**) p ≤ 0.01 compared with untreated control (Bonferroni's multiple comparison test).
Figure 3
Figure 3
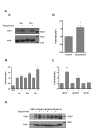
TSP1 expression by LNCaP cells after tasquinimod exposure in in vitro cell cultures. (A) Up-regulation of the TSP1 protein levels by tasquinimod (50 μM) in LNCaP cells was measured by western blot analysis (left panel (i)). Protein bands represent intact TSP1 at ~160 kD (monoclonal Ab11). TSP1 secreted into cell culture medium was measured with ELISA after 72 h (right panel (ii)). The culture medium levels of TSP1 were 50.8 ± 1.5 ng/ml for untreated cells and 80.6 ± 10.2 ng/ml for exposed cells, respectively (n = 3; p ≤ 0.05, ANOVA). (B) TSP1 secretion into cell culture medium after exposure of LNCaP cells to 10 μM tasquinimod (+) (p ≤ 0.01, ANOVA). TSP1 levels in untreated (-) cell culture medium were 22, 36.6 and 51.6 ng/ml after 6, 24 and 72 h incubation, respectively, and 6 ng/ml in the R10 medium. (C) Up-regulation of TSP1 mRNA levels occurred in the hormone independent prostate cancer cell line LNCaP19 but not in DU145, (-) untreated control and (+) 10 μM tasquinimod (p ≤ 0.0001; ANOVA). Presented data represent the mean ± SD of at least two independent experiments. (*) p ≤ 0.05 and (**) p ≤ 0.01 compared with untreated control (Bonferroni's multiple comparison test). (D) TSP1 protein levels measured by western blot analysis of prostate cancer cell lysates, (-) untreated control and (+) 10 μM tasquinimod for 72 h. PL indicates lysate prepared from human platelets and rTSP1 is recombinant TSP1.
Figure 4
Figure 4
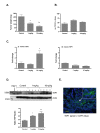
Anti-tumor effect and up-regulation of tumor associated human TSP1 mRNA levels in tasquinimod treated LNCaP tumors. Anti-tumor effect in nude mice carrying subcutaneous LNCaP tumors treated with tasquinimod (10 mg/kg/day) for three weeks. The treatment started 7 days after inoculation, and expressed data represent the mean tumor weight ± SD (n = 5; p = 0.0076, ANOVA). (B) VEGF levels were measured in processed tumor tissue by ELISA. (C) Up-regulation, monitored with real-time qRT-PCR, of tumor associated human TSP1 mRNA levels ((i); p = 0.0216, ANOVA) in LNCaP tumors. To distinguish between mRNA from human tumor cells and infiltrating mouse cells, TSP1 mRNA was analyzed using primers specific for human (i) or mouse (ii) sequences with the same probe set (Table 2). (D) Elevated protein levels of tumor-produced human TSP1 (rabbit polyclonal Ab8). Each lane represents a tumor sample from an individual animal. Calculated ratios between the major band of intact TSP1 (approximately at 150-160 kD) and actin in each lane show a significant (p = 0.0004, ANOVA) up-regulation of TSP1 tumor levels in exposed animals ((+); n = 4) compared to untreated controls (-). (*) p ≤ 0.05 and (**) p ≤ 0.01 (Bonferroni's multiple comparison test). (E) TSP1 expression (green) analyzed by IHC microscopy in LNCaP tumor tissue exposed in vivo to tasquinimod at 10 mg/kg/day (bar = 50 μm). TSP1 was mainly localized in the extra cellular matrix (inset). Blue shows DAPI staining.
Figure 5
Figure 5
Tasquinimod blocks the angiogenic switch in CWR-22RH tumors. Inhibition of the "angiogenic switch" was illustrated in treated CWR-22RH tumors. (A) Tumor growth reduction of CWR-22RH human prostate tumors inoculated into nude mice after oral treatment with tasquinimod at 10 mg/kg/day, data points represent the average ± SD, (n = 5, (**) p = 0.002; Mann-Whitney U). (B) Reduced tumor levels of VEGF, a downstream HIF1α target gene. Bars represent the mean ± SD, n = 5 and (*) p < 0.05. (C) The up-regulation of TSP1 (mouse monoclonal Ab11) in tumor tissue excised and prepared as whole cell lysates (10,000 g supernatant) was accompanied with a down-regulation of the androgen receptor (AR), HIF1α, and Glut-1. (i) Each lane represents a tumor sample from an individual animal (#11 to #15 controls and #21 to #25 exposed to tasquinimod). Molecular weight markers for each blot are indicated. (ii) Calculated ratios between the major protein bands and actin for each lane show a statistical significant difference between exposed animals (#T21 - #T25) compared to untreated controls (#T11-#T15). (*) p ≤ 0.05, (**) p ≤ 0.01 and (***) p ≤ 0.001 (Bonferroni's multiple comparison test).

References

    1. Folkman J, Merler E, Abernathy C, Williams G. Isolation of a tumor factor responsible for angiogenesis. J Exp Med. 1971;133:275–288. doi: 10.1084/jem.133.2.275. - DOI - PMC - PubMed
    1. Hanahan D, Folkman J. Patterns and emerging mechanisms of the angiogenic switch during tumorigenesis. Cell. 1996;86:353–364. doi: 10.1016/S0092-8674(00)80108-7. - DOI - PubMed
    1. Bratt O, Haggman M, Ahlgren G, Nordle O, Bjork A, Damber JE. Open-label, clinical phase I studies of tasquinimod in patients with castration-resistant prostate cancer. Br J Cancer. 2009;101(8):1233–40. doi: 10.1038/sj.bjc.6605322. - DOI - PMC - PubMed
    1. Dalrymple SL, Becker RE, Isaacs JT. The quinoline-3-carboxamide anti-angiogenic agent, tasquinimod, enhances the anti-prostate cancer efficacy of androgen ablation and taxotere without effecting serum PSA directly in human xenografts. Prostate. 2007;67:790–797. doi: 10.1002/pros.20573. - DOI - PubMed
    1. Isaacs JT, Pili R, Qian DZ, Dalrymple SL, Garrison JB, Kyprianou N, Bjork A, Olsson A, Leanderson T. Identification of ABR-215050 as lead second generation quinoline-3-carboxamide anti-angiogenic agent for the treatment of prostate cancer. Prostate. 2006;66:1768–1778. doi: 10.1002/pros.20509. - DOI - PubMed

Publication types

MeSH terms