. 2010 May 25;20(10):895-903.
doi: 10.1016/j.cub.2010.04.027. Epub 2010 May 13.

Rapid expansion and functional divergence of subtelomeric gene families in yeasts

Affiliations

Rapid expansion and functional divergence of subtelomeric gene families in yeasts

Chris A Brown et al. Curr Biol. .

Abstract

Background: Subtelomeres, regions proximal to telomeres, exhibit characteristics unique to eukaryotic genomes. Genes residing in these loci are subject to epigenetic regulation and elevated rates of both meiotic and mitotic recombination. However, most genome sequences do not contain assembled subtelomeric sequences, and, as a result, subtelomeres are often overlooked in comparative genomics.

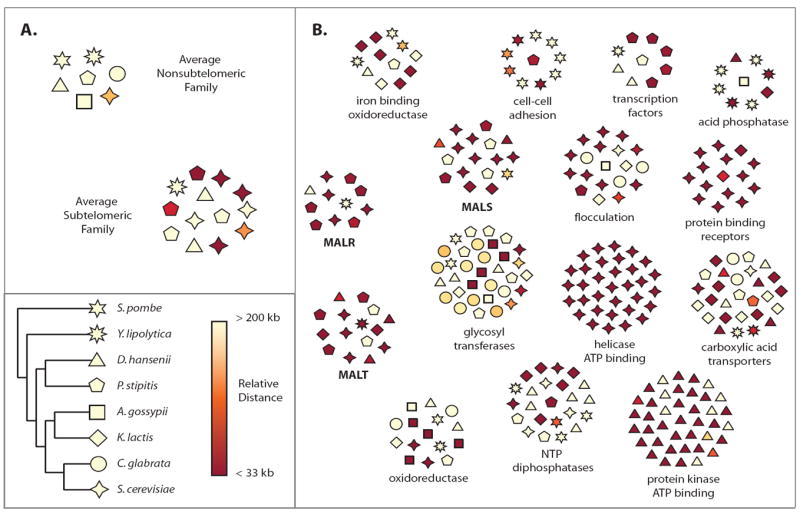
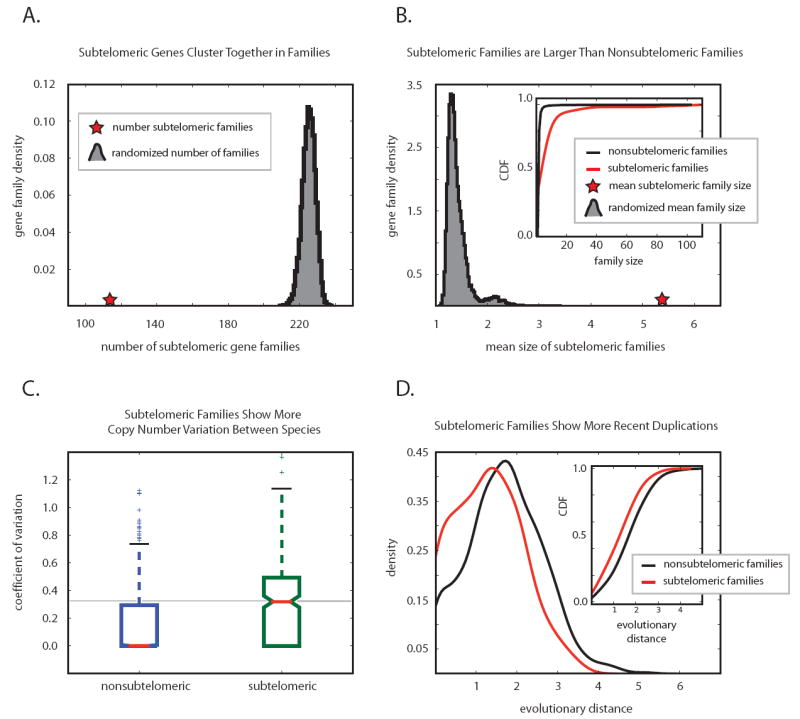
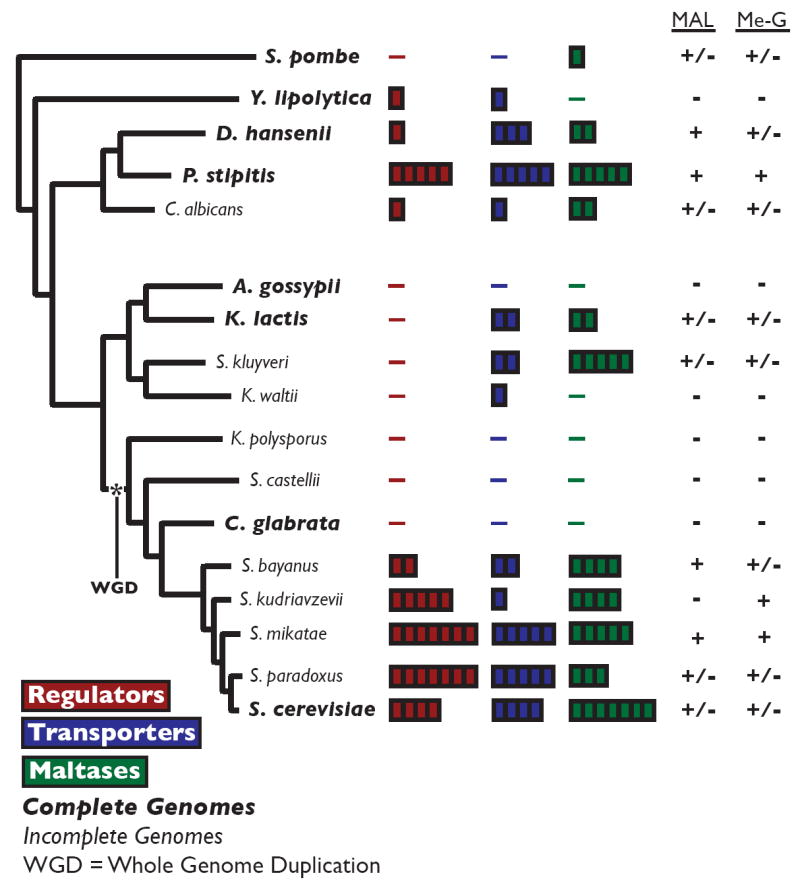
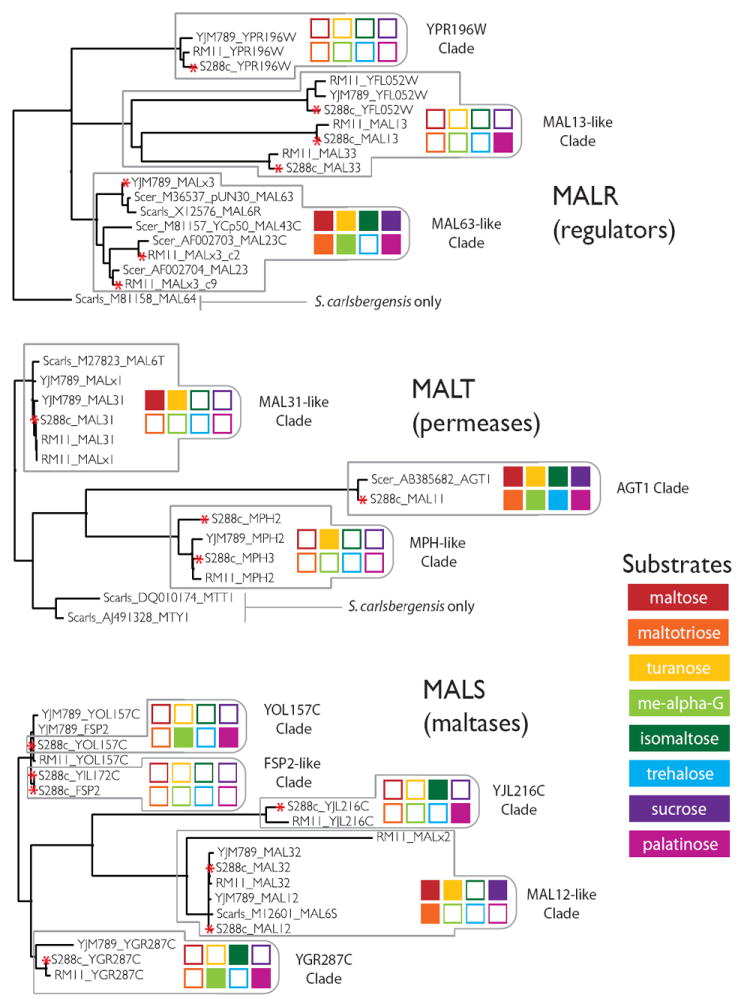
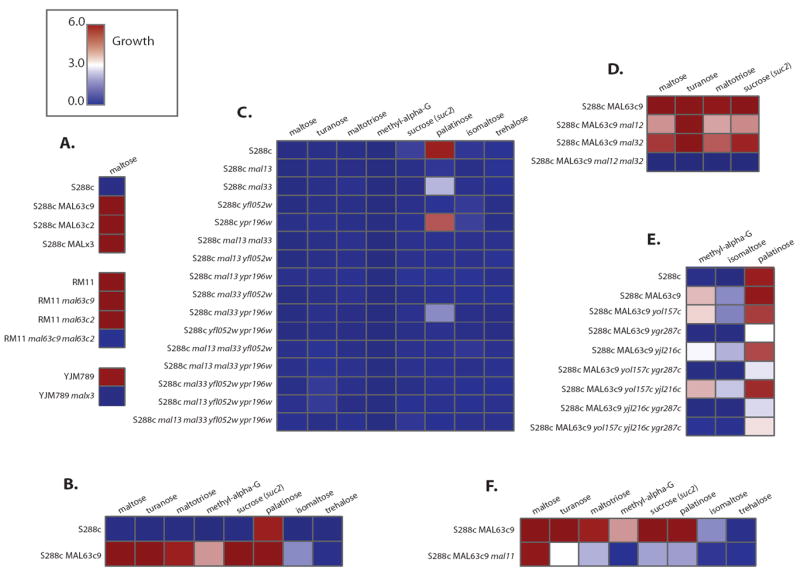
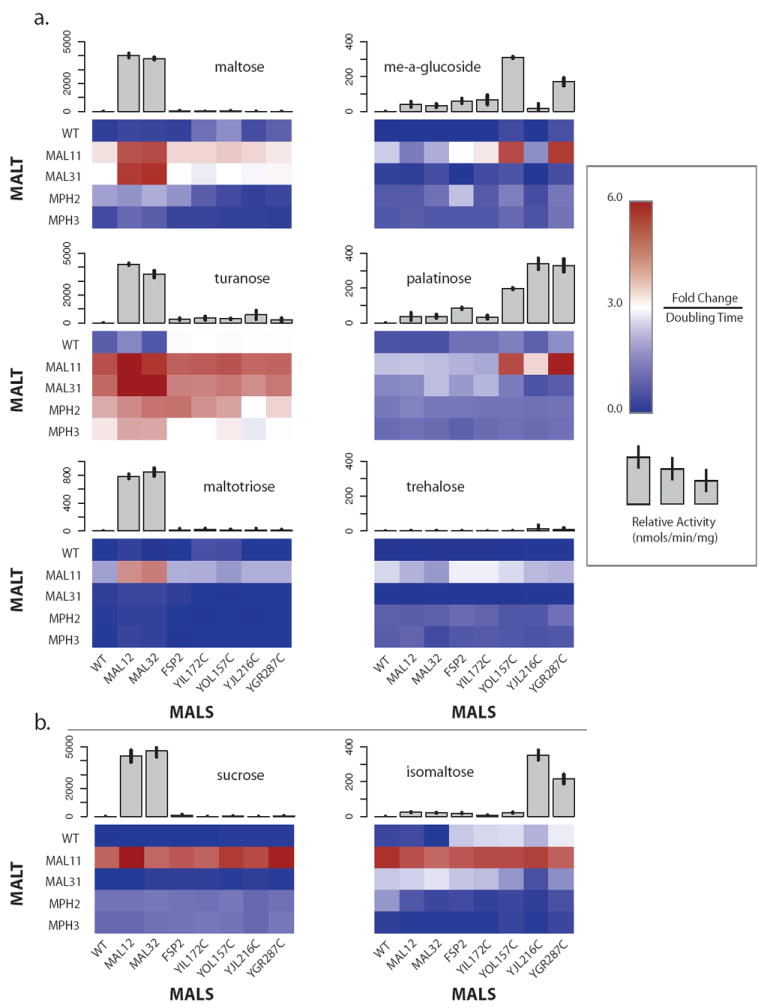
Results: We studied the evolution and functional divergence of subtelomeric gene families in the yeast lineage. Our computational results show that subtelomeric families are evolving and expanding much faster than families that do not contain subtelomeric genes. Focusing on three related subtelomeric MAL gene families involved in disaccharide metabolism that show typical patterns of rapid expansion and evolution, we show experimentally how frequent duplication events followed by functional divergence yield novel alleles that allow the metabolism of different carbohydrates.

Conclusions: Taken together, our computational and experimental analyses show that the extraordinary instability of eukaryotic subtelomeres supports rapid adaptation to novel niches by promoting gene recombination and duplication followed by functional divergence of the alleles.


Figures

Figure 1
Figure 1. Overview of subtelomeric families vs. non-subtelomeric families
Subtelomeric families are more volatile than non-subtelomeric families. Every gene family (orthogroup) is shown as a number of polygons (individual genes per gene family) spatially arranged in a circular area. The polygons are colored according to their closest distance (denoted as relative distance in the figure) to a chromosome end going from pale yellow (> 200 kb away from the nearest chromosome end) to dark red (< 33 kb from the nearest chromosome end). The individual species are denoted by the eight differently shaped polygons (e.g. triangle for D. hansenii). A. The average composition of non-subtelomeric gene families and subtelomeric gene families is represented by two clusters (artificial clusters representing the mean copy number and mean distance to the telomere for subtelomeric and non-subtelomeric gene families). Non-subtelomeric gene families show small differences in copy number between species such that species contain around the same number of genes, and show few genes within 200 kb of chromosome end. Strikingly, subtelomeric gene families show high copy number variation between species, and have more genes within 200 kb (and especially within 33 kb) of the chromosome end. B. Some representative subtelomeric gene families are shown along with their functional annotation. Common characteristics among subtelomeric gene families can be seen; high copy number variation can be seen between species as well as multiple members less than 200 kb from the nearest chromosome end. The three MAL gene families, MALR, MALT, and MALS are shown in bold text. See Figure S1 and Table S1 for more information.
Figure 2
Figure 2. Computational Results
Subtelomeric gene families are larger and evolve faster. All S. cerevisiae genes were divided into gene families based on their homology (see text for details). Families containing at least one gene located within 33kb of a telomere were classified as subtelomeric gene families, all other families are non-subtelomeric families. Although we use the same 33 kb cutoff and the same MCL clustering parameters for our analyses, our results remain unchanged when we alter the definition of the subtelomeric region, and also when we alter the parameters for MCL gene clustering. A. The total number of subtelomeric gene families (114, red star) is smaller than what would be expected if all genes (subtelomeric and non-subtelomeric) were randomly distributed among gene families (grey curve, representing the number of gene families with subtelomeric members after 10000 randomizations). B. Subtelomeric gene families on average contain two to four times more genes than non-subtelomeric families. The red star represents the average family size of subtelomeric families in Saccharomyces cerevisiae at a 33 kb cutoff. The grey distribution shows the mean size of 10000 gene families that were chosen randomly amongst all gene families. A complementary analysis contrasting the cumulative distribution functions of subtelomeric gene family size (red) and non-subtelomeric gene family size (black) is consistent with the larger size of subtelomeric families. C. Subtelomeric gene families show increased copy number variation. The distribution of coefficients of variation (standard deviation normalized by mean, a metric of the extent variation) of the number of genes for all subtelomeric and non-subtelomeric gene families shows that subtelomeric gene families exhibit drastically higher copy number variation than non-subtelomeric gene families. D. The distribution of intraspecies protein distances (similarities) is compared for subtelomeric gene families (red) versus non-subtelomeric gene families (black). Subtelomeric gene families contain more closely related intraspecies proteins (recent duplications) than non-subtelomeric gene families, which is reflected in a shift of the distribution to the left. The inset compares the cumulative distribution functions of the intraspecies protein distances and shows a significant shift of the subtelomeric families towards newer duplications. See Figure S2 and Table S2 for more information.
Figure 3
Figure 3. MAL CNV in Fungal Lineage
The MAL gene family shows extreme copy number variation in yeasts, and the presence of MAL genes correlates with the ability to grown on maltose and methyl-α-glucoside. The species names of genomes that have been completely sequenced and assembled are indicated in bold. The number of MAL regulator genes (red), MAL transporter genes (blue) and MAL maltase genes (green) is denoted by the number of blocks to the right of the species name. The panel on the right indicates whether (+) or not (-) individual strains grow on maltose (MAL) and methyl-α-glucoside (Me-G). Strain-dependent growth is denoted as +/-. See Figure S3 and Table S3 for more information.
Figure 4
Figure 4. Phylogeny of MAL genes in S. cerevisiae
The MAL gene families sub-divide into tight subfamilies (clades) that correlate with specificity towards specific substrates. The phylogeny of the MAL regulators, transporters, and maltases, determined from multiple protein sequence alignments, is shown for alleles from Saccharomyces cerevisiae strains S288c, YJM789, and RM11, as well as alleles deposited in GenBank from Saccharomyces cerevisiae and Saccharomyces pastorianus. Individual subfamilies are outlined with grey boxes, in which specificity is denoted by a colored barcode. A red asterisk to the left of the allele name denotes that the function of this allele was experimentally investigated. The function of alleles that are not marked by an asterisk was not experimentally verified (in these cases, the function was only inferred from the sequence similarity with other alleles in the same clade). The specificity of the individual families was determined as follows. Combinatorial knockouts of MALR alleles in S288c (Figure 5C), knockins of MALR alleles from RM11 and YJM789 into S288c (Figure 5A & 5B), and combinatorial knockouts of MALR alleles in RM11 and YJM789 (Figure 5A), were used to determine MALR allele specificity. Overexpression of MALT alleles in S288c (Figure 6A & 6B) and knockouts of MALT alleles in S288c (Figure 5F) were used to determine MALT allele specificity. Combinatorial knockouts of MALS alleles in S288c (Figure 5D & 5E), overexpression of MALS alleles in S288c (Figure 6A & 6B), and purified enzyme assays of MalS proteins (Figure 6A & 6B), were used to determine MALS allele specificity. For more detailed information about assays, see Materials and Methods. Activity of a subfamily is summarized for maltose (red), maltotriose (orange), turanose (yellow), methyl-α-glucoside (lime green), isomaltose (green), trehalose (light blue), sucrose (purple), and palatinose (magenta). Activity towards a specific substrate is indicated by a solid colored square, while lack of activity for a specific substrate is depicted by white boxes with colored outlines. See Figure S4 for more information.
Figure 5
Figure 5. Growth Data for MAL mutants
MAL deletion mutants confirm phenotypes and functional divergence. Growth of various MAL mutants is portrayed in a heatmap going from no growth (dark blue, 0.0) to strong growth (dark red, 6.0). A. S288c wild-type strain fails to grow on maltose while RM11 and YJM789 both grow on maltose. Transforming either a functional regulator from RM11 or YJM789 confers growth in S288c. Conversely, removing the functional regulator from YJM789, or both functional regulators from RM11 renders both strains unable to grow on maltose. B. The functional regulator from RM11, MAL63c9 (MAL63 found on supercontig 9 in RM11 (see Figure S5)), is not only required for growth on maltose, but is also required for growth on turanose, maltotriose, methy-α-glucoside, sucrose (suc2 mutant), palatinose, and isomaltose. C. All possible combinatorial knockouts of MAL regulators in S288c reveal that MAL13 and YFL052W are required for growth on palatinose, while the absence of MAL33 reduces growth on this carbon source. D. Two maltases, MALS genes, MAL12 and MAL32, are required for growth on maltose, turanose, maltotriose, and sucrose (the latter tested in a suc2 mutant), while the other MALS family members don’t affect the phenotype. E.YGR287C, a MALS gene, is the only MALS family member required for growth on palatinose, isomaltose, and methyl-α-glucoside. F. Removal of MAL11 permease renders strains unable to grow on most α-glucosides. See Figure S5 for more information.
Figure 6
Figure 6. Growth & Enzyme Assays
Growth and enzyme assays of MAL overexpression mutants show the functional divergence in the MAL families. Growth in various α-glucosides of S. cerevisiae S288c diploids resulting from a cross of a MALT (rows) overexpression strain and a MALS (columns) overexpression strain is shown as a heatmap. It is important to note that the upper left entry in the heatmap is a WT S288c diploid that is a control for growth. For all of the sugars except palatinose and sucrose, the genotype of the diploids is S288c, with exception of the MALS and MALT modifications. For palatinose, S288c mal13/mal13 diploids were used, while for sucrose S288c suc2/suc2 diploids were used. Relative activity in units of nmols/min/mg of purified MALS proteins is shown as grey bar graphs above the respective MALS column in the heatmap. Individual family members are denoted beside their row or column in the heatmap. A. Growth of the diploids in maltose, maltotriose, methyl-α-glucoside, palatinose, trehalose, and turanose correlates well with the relative activity of the purified enzymes, and implicates specific combinations of MALT and MALS alleles. B. Growth of the diploids in sucrose and isomaltose is dependent on the MAL11 family member of MALT and no specific MALS family members, while the enzyme assays indicate specific MALS proteins. This is most likely due to MALR alleles responding to the imported sugars and upregulating the pertinent MALS alleles once the native regulation of the MAL11 allele of MALT has been bypassed. Deletion of the putative MALS alleles indicated by the enzyme assays confirms their specificity for sucrose (Figure 5D) and isomaltose (Figure 5E). See Figure S6 for more information.

References

    1. Pryde FE, Gorham HC, Louis EJ. Chromosome ends: all the same under their caps. Curr Opin Genet Dev. 1997;7:822–828. - PubMed
    1. Cohn M, Liti G, Barton DBH. Telomeres in fungi. Top Curr Genet. 2006;15:101–130.
    1. Mefford H, Trask B. The complex structure and dynamic evolution of human subtelomeres. Nat Rev Genet. 2002;3:91–102. - PubMed
    1. Pryde F, Louis E. Limitations of silencing at native yeast telomeres. EMBO J. 1999;18:2538–2550. - PMC - PubMed
    1. Gottschling DE, Aparicio OM, Billington BL, Zakian VA. Position effect at S. cerevisiae telomeres: reversible repression of Pol II transcription. Cell. 1990;63:751–762. - PubMed

Publication types