. 2010 May 28;32(5):642-53.
doi: 10.1016/j.immuni.2010.04.012. Epub 2010 May 13.

Transforming growth factor-beta signaling curbs thymic negative selection promoting regulatory T cell development

Affiliations

Transforming growth factor-beta signaling curbs thymic negative selection promoting regulatory T cell development

Weiming Ouyang et al. Immunity. .

Abstract

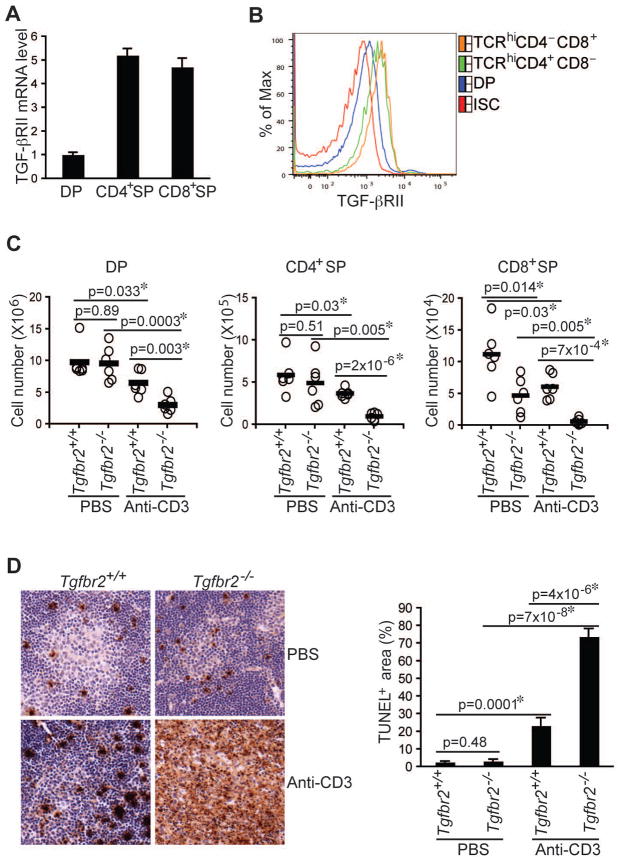
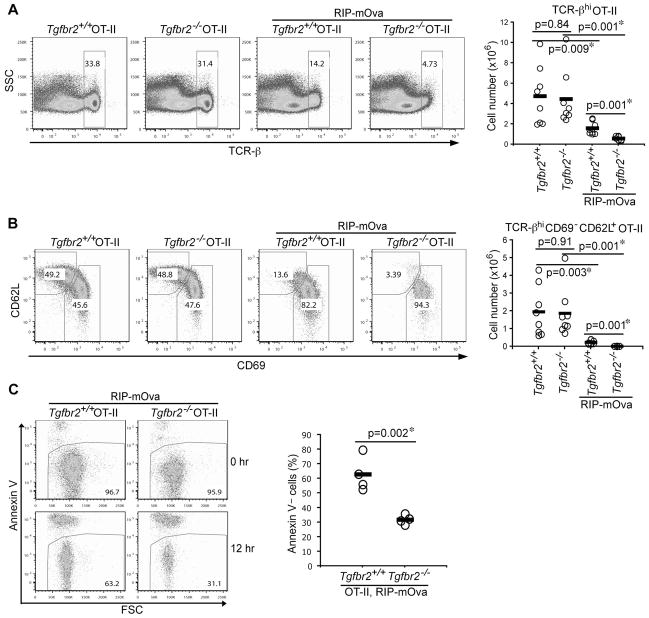
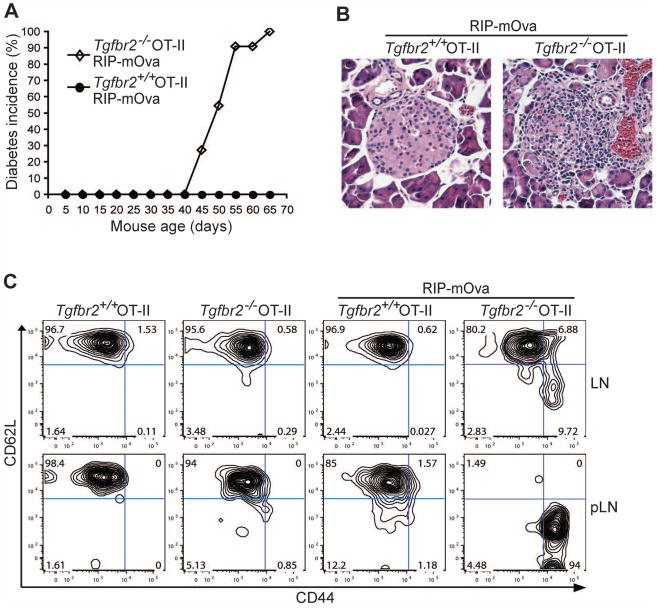
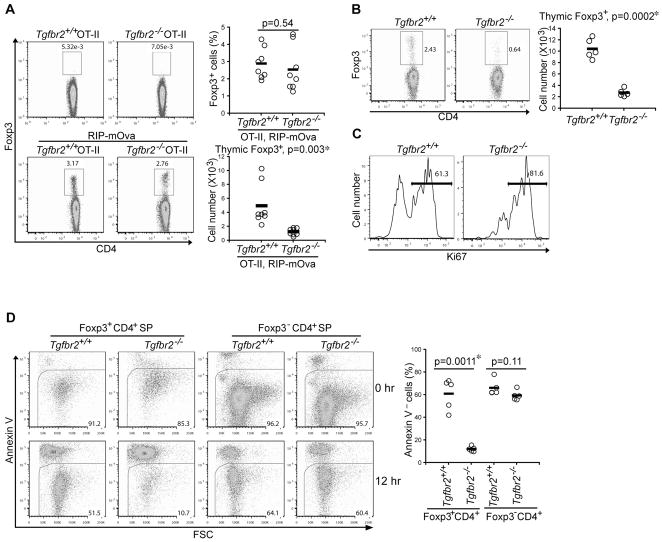
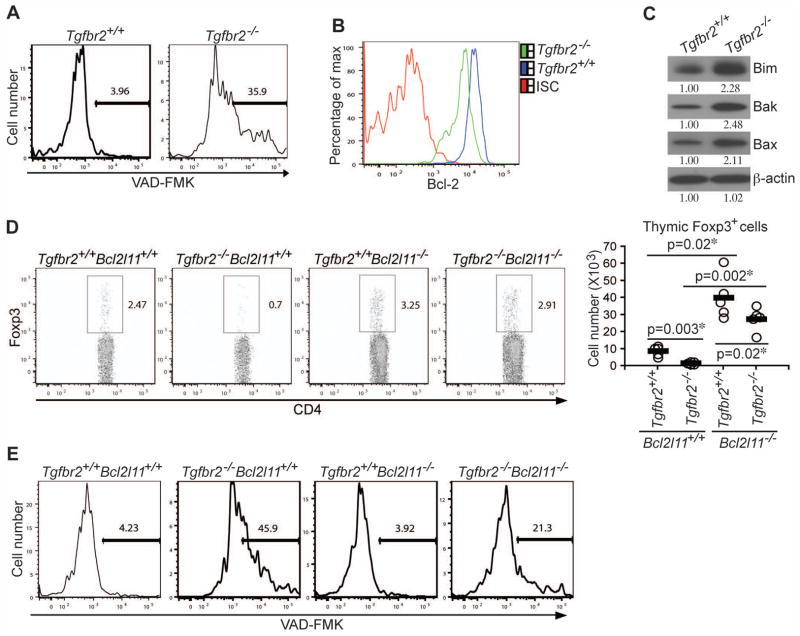
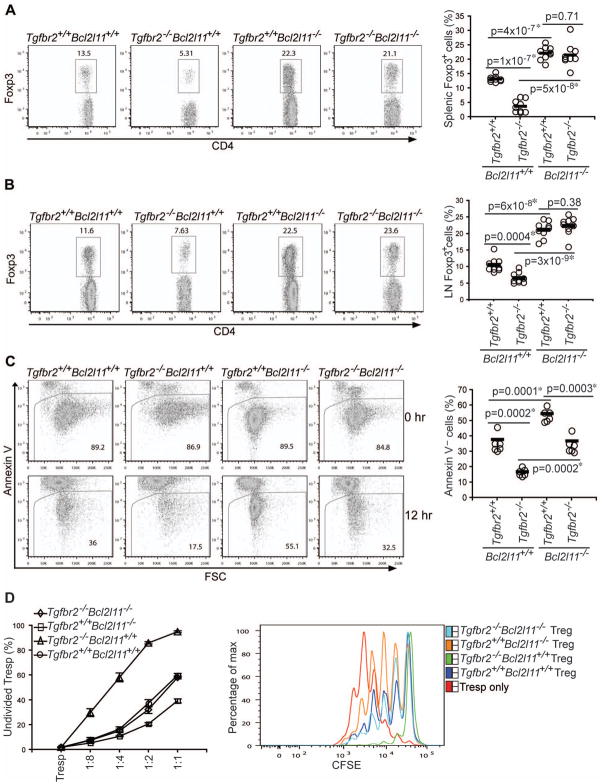
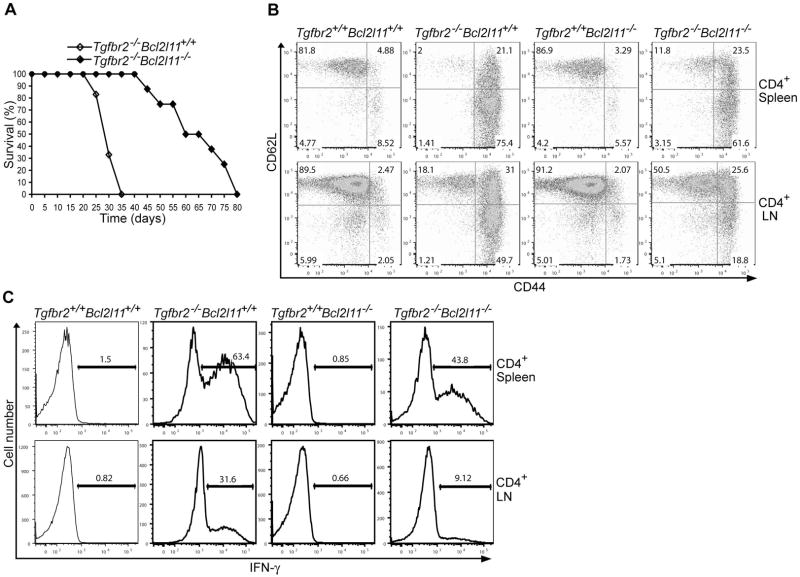
Thymus-derived naturally occurring regulatory T (nTreg) cells are necessary for immunological self-tolerance. nTreg cell development is instructed by the T cell receptor and can be induced by agonist antigens that trigger T cell-negative selection. How T cell deletion is regulated so that nTreg cells are generated is unclear. Here we showed that transforming growth factor-beta (TGF-beta) signaling protected nTreg cells and antigen-stimulated conventional T cells from apoptosis. Enhanced apoptosis of TGF-beta receptor-deficient nTreg cells was associated with high expression of proapoptotic proteins Bim, Bax, and Bak and low expression of the antiapoptotic protein Bcl-2. Ablation of Bim in mice corrected the Treg cell development and homeostasis defects. Our results suggest that nTreg cell commitment is independent of TGF-beta signaling. Instead, TGF-beta promotes nTreg cell survival by antagonizing T cell negative selection. These findings reveal a critical function for TGF-beta in control of autoreactive T cell fates with important implications for understanding T cell self-tolerance mechanisms.


Conflict of interest statement

Competing Interest Statement

The authors declare that they have no competing financial interests.

Figures

Figure 1
Figure 1. Enhanced Anti-CD3-induced T Cell Apoptosis in TGF-βRII-deficient Mice
(A, B) TGF-βRII expression in CD4+CD8+ double positive (DP), CD4+CD8 single positive (CD4+SP) and CD4CD8+ (CD8+SP) thymocytes was determined by quantitative PCR (A) and Flow cytometric analysis (B). ISC stands for iso-type control. (C, D) Four-day-old wild-type (Tgfbr2+/+) and TGF-βRII-deficient (Tgfbr2−/−) mice were intraperitoneally injected with PBS or 20 μg/mouse of anti-CD3. Cell numbers of DP, CD4+SP, and CD8+SP thymocytes were determined 24 hr after the injection (C, n=6). Thymocyte apoptosis was examined by TUNEL staining 48 hr after the injection (D, left panel, original magnification, 20×). TUNEL staining-positive area of 4 sections per group was quantified by MetaMoph software (D, right panel). Data are representative of two (A) and three (B–D) independent experiments. The p values between the groups are shown. *depicts significant difference.
Figure 2
Figure 2. Exaggerated T cell Negative Selection in the absence of TGF-β Signaling
(A) Flow cytometric analysis of TCR-β expression in thymic OT-II T cells from 5-week-old Tgfbr2+/+ and Tgfbr2−/− OT-II mice in the absence or presence of RIP-mOva transgene (left panel). The numbers of thymic TCR-βhi OT-II T cells from 8 groups of mice are shown (right panel). (B) Flow cytometric analysis of CD69 and CD62L expression in thymic TCR-βhi OT-II T cells from 5-week-old Tgfbr2+/+ and Tgfbr2−/− OT-II mice in the absence or presence of RIP-mOva transgene (left panel). The numbers of thymic TCR-βhiCD69CD62L+ OT-II T cells from 8 groups of mice are shown (right panel). (C) Survival of thymic OT-II T cells from Tgfbr2+/+ and Tgfbr2−/− mice. Thymic TCR-βhi OT-II T cells were purified by FACS sorting, and cultured for 12 hr. T cell viability before and after the cell culture was determined by annexin V staining (left panel). Percentages of viable T cells at 12 hr from 4 pairs of mice are presented (right panel). The p values between the groups are shown. *depicts significant difference.
Figure 3
Figure 3. Diabetes Development and T cell Activation in TGF-βRII-deficient OT-II RIP-mOva Mice
(A) The incidence of diabetes in Tgfbr2+/+ and Tgfbr2−/− OT-II RIP-mOva mice (n=11). (B) Hematoxylin and eosin staining of the pancreas of 8-week-old Tgfbr2+/+ and Tgfbr2−/− OT-II RIP-mOva mice (original magnification, 20×). These are representative results of four mice per group analyzed. (C) Flow cytometric analysis of CD44 and CD62L expression in OT-II T cells from non-pancreatic control lymph nodes (LN) and pancreatic lymph nodes (pLN) of 5-week-old Tgfbr2+/+ and Tgfbr2−/− OT-II mice in the absence or presence of RIP-mOva transgene. Data are representative of three independent experiments.
Figure 4
Figure 4. TGF-β Control of Thymic nTreg Survival
(A) Thymic nTregs from 5-week-old Tgfbr2+/+ and Tgfbr2−/− OT-II mice in the absence or presence RIP-mOva transgene. Foxp3 expression in TCR-βhi OT-II T cells (left panel), and the percentages (right top panel) and numbers (right bottom panel) of nTregs from Tgfbr2+/+ and Tgfbr2−/− OT-II RIP-mOva mice are shown (n=8). (B) Thymic nTregs in 3–5-day-old Tgfbr2+/+ and Tgfbr2−/− mice. Foxp3 expression in TCR-βhiCD4+ T cells (left panel), and nTreg numbers from Tgfbr2+/+ and Tgfbr2−/− mice (right panel) are shown (n=5). (C) Flow cytometric analysis of Ki67 expression in thymic nTregs from 3–5-day-old Tgfbr2+/+ and Tgfbr2−/− mice. These are representative results of four mice per group analyzed. (D) Thymic Foxp3+CD4+ single positive (SP) nTregs and Foxp3CD4+ SP conventional T cells were purified by FACS sorting from 14–16-day-old Tgfbr2+/+ and Tgfbr2−/− mice, and cultured for 12 hr. T cell viability before and after the cell culture was determined by annexin V staining (left panel). Percentages of viable T cells at 12 hr from 5 pairs of mice are presented (right panel). The p values between the groups are shown. *depicts significant difference.
Figure 5
Figure 5. TGF-β Signaling Regulates Thymic nTreg Development via the Inhibition of Bim-dependent Apoptosis
(A) Flow cytometric analysis of caspase activation in 4-day-old thymic nTregs from Tgfbr2+/+ and Tgfbr2−/− mice. These are representative results of four mice per group analyzed. (B) Flow cytometric analysis of Bcl-2 expression in thymic nTregs from Tgfbr2+/+ and Tgfbr2−/− mice. ISC stands for the isotype control antibody. (C) The expression of Bim, Bak, and Bax in thymic nTregs from Tgfbr2+/+ and Tgfbr2−/− mice was determined by immunoblotting. β-actin was used as a protein-loading control. Band densities were quantified by ImageJ. The relative protein amounts are shown. Data are representative of three independent experiments. (D) Restoration of thymic nTreg development in Tgfbr2−/− mice by Bim deletion. Foxp3 expression in thymic TCR-βhiCD4+ T cells from 4-day-old Tgfbr2+/+Bcl2l11+/+, Tgfbr2−/−Bcl2l11+/+, Tgfbr2+/+Bcl2l11−/−, and Tgfbr2−/−Bcl2l11−/− mice (left panel), and nTreg numbers from 5 groups of 3–5-day-old mice are presented (right panel). The p values between the groups are shown. *depicts significant difference. (E) Flow cytometric analysis of caspase activation in thymic nTregs from Tgfbr2+/+Bcl2l11+/+, Tgfbr2−/−Bcl2l11+/+, Tgfbr2+/+Bcl2l11−/−, and Tgfbr2−/−Bcl2l11−/− mice. A representative of three independent experiments is shown.
Figure 6
Figure 6. Bim Ablation Restores Peripheral Tregs in TGF-βRII-deficient Mice
(A, B) Flow cytometric analysis of Foxp3 expression in splenic (A) and lymph node (LN) (B) CD4+ T cells from 16-day-old Tgfbr2+/+Bcl2l11+/+, Tgfbr2−/−Bcl2l11+/+, Tgfbr2+/+Bcl2l11−/−, and Tgfbr2−/−Bcl2l11−/− mice (left panels). Treg percentages from 8 groups of 14–16-day-old mice are shown (right panels). (C) Splenic and lymph node Tregs were purified from 16-day-old Tgfbr2+/+Bcl2l11+/+, Tgfbr2−/−Bcl2l11+/+, Tgfbr2+/+Bcl2l11−/− and Tgfbr2−/− Bcl2l11−/− mice by FACS sorting, and cultured for 12 hr. T cell viability before and after the cell culture was determined by annexin V staining (left panel). Percentages of viable T cells at 12 hr from 6 groups of 14–16-day-old mice are presented (right panel). The p values between the groups are shown. *depicts significant difference. (D) Suppressive function of Tgfbr2+/+Bcl2l11+/+, Tgfbr2−/−Bcl2l11+/+, Tgfbr2+/+Bcl2l11−/−, and Tgfbr2−/−Bcl2l11−/− Tregs. Splenic and lymph node Foxp3+CD4+ Tregs were isolated from Tgfbr2+/+Bcl2l11+/+, Tgfbr2−/−Bcl2l11+/+, Tgfbr2+/+Bcl2l11−/−, and Tgfbr2−/−Bcl2l11−/− mice. CD44loCD4+ T cells from Tgfbr2+/+Bcl2l11+/+ mice were labeled with CFSE, and used as responding T cells (Tresp). Cell division was assessed by CFSE dilution. The percentages of undivided Tresp cells (Y axis) and the ratios of cell numbers between Treg and Tresp cells (X axis) were plotted (left panel). A representative of CFSE dilution of Tresp cells cultured in the absence or presence of 1:2 ratio of Tregs to Tresp cells was shown (right panel). These are representative of three independent experiments.
Figure 7
Figure 7. Bim Ablation Partially Restores T Cell Tolerance in TGF-βRII-deficient Mice
(A) Survival of Tgfbr2−/−Bcl2l11+/+ (n=18) and Tgfbr2−/−Bcl2l11−/− (n=8) mice. (B) Flow cytometric analysis of CD44 and CD62L expression in splenic and lymph node (LN) CD4+ T cells from 14-day-old Tgfbr2+/+Bcl2l11+/+, Tgfbr2−/−Bcl2l11+/+, Tgfbr2+/+Bcl2l11−/−, and Tgfbr2−/−Bcl2l11−/− mice. These are representative results of four mice per group analyzed. (C) Splenic and LN CD4+ T cells from 14-day-old Tgfbr2+/+Bcl2l11+/+, Tgfbr2−/−Bcl2l11+/+, Tgfbr2+/+Bcl2l11−/−, and Tgfbr2−/−Bcl2l11−/− mice were stimulated with PMA and ionomycin for 4 hr, and analyzed for the expression of IFN-γ by intracellular staining. A representative of three independent experiments is shown.

Comment in

References

    1. Anderson MS, Venanzi ES, Chen Z, Berzins SP, Benoist C, Mathis D. The cellular mechanism of Aire control of T cell tolerance. Immunity. 2005;23:227–239. - PubMed
    1. Apostolou I, Sarukhan A, Klein L, von Boehmer H. Origin of regulatory T cells with known specificity for antigen. Nat Immunol. 2002;3:756–763. - PubMed
    1. Bautista JL, Lio CW, Lathrop SK, Forbush K, Liang Y, Luo J, Rudensky AY, Hsieh CS. Intraclonal competition limits the fate determination of regulatory T cells in the thymus. Nat Immunol. 2009;10:610–617. - PMC - PubMed
    1. Bouillet P, Purton JF, Godfrey DI, Zhang LC, Coultas L, Puthalakath H, Pellegrini M, Cory S, Adams JM, Strasser A. BH3-only Bcl-2 family member Bim is required for apoptosis of autoreactive thymocytes. Nature. 2002;415:922–926. - PubMed
    1. Bouneaud C, Kourilsky P, Bousso P. Impact of negative selection on the T cell repertoire reactive to a self-peptide: a large fraction of T cell clones escapes clonal deletion. Immunity. 2000;13:829–840. - PubMed

Publication types

MeSH terms

Substances