

Assessment of a scalp EEG-based automated seizure detection system
- PMID: 20471311
- PMCID: PMC2934863
- DOI: 10.1016/j.clinph.2010.04.016
Assessment of a scalp EEG-based automated seizure detection system
Abstract
Objective: The purpose of this study was to evaluate and validate an offline, automated scalp EEG-based seizure detection system and to compare its performance to commercially available seizure detection software.
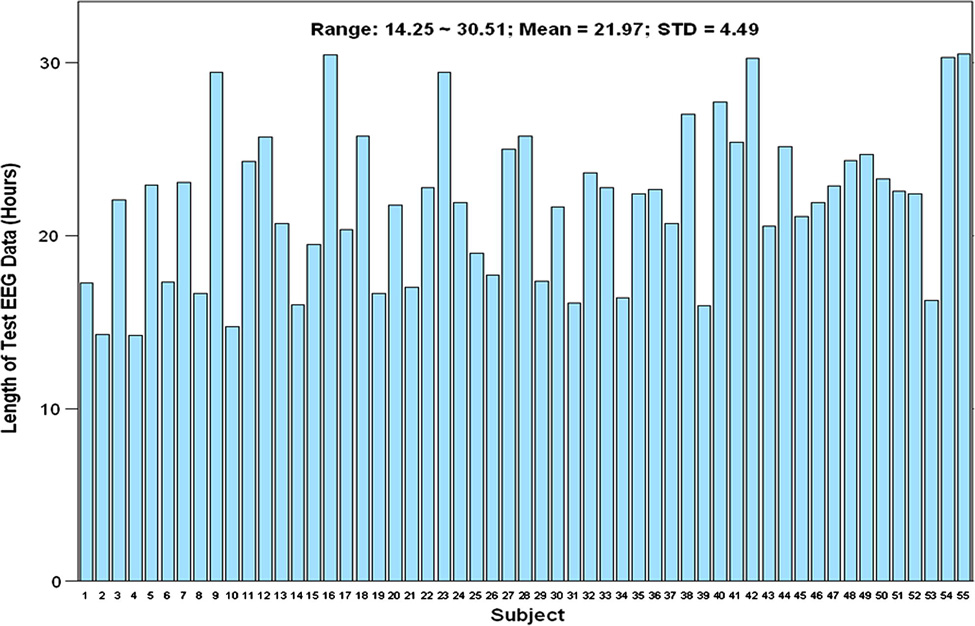
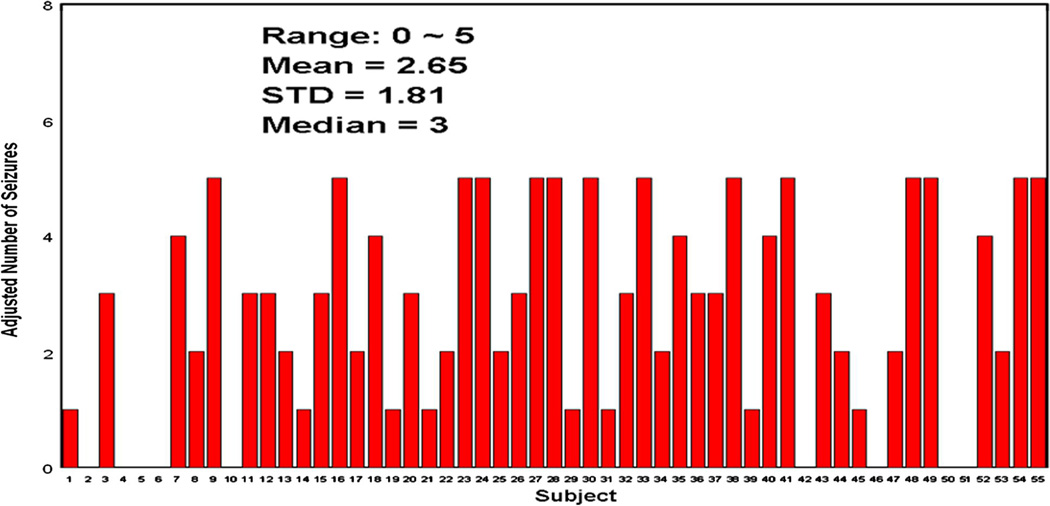
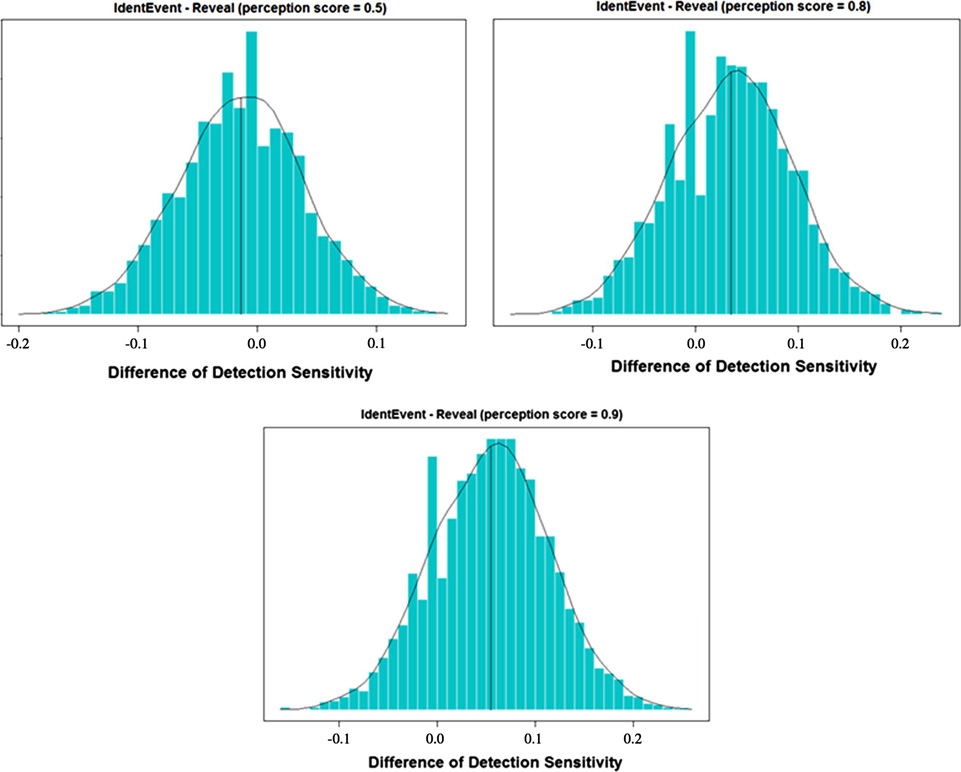
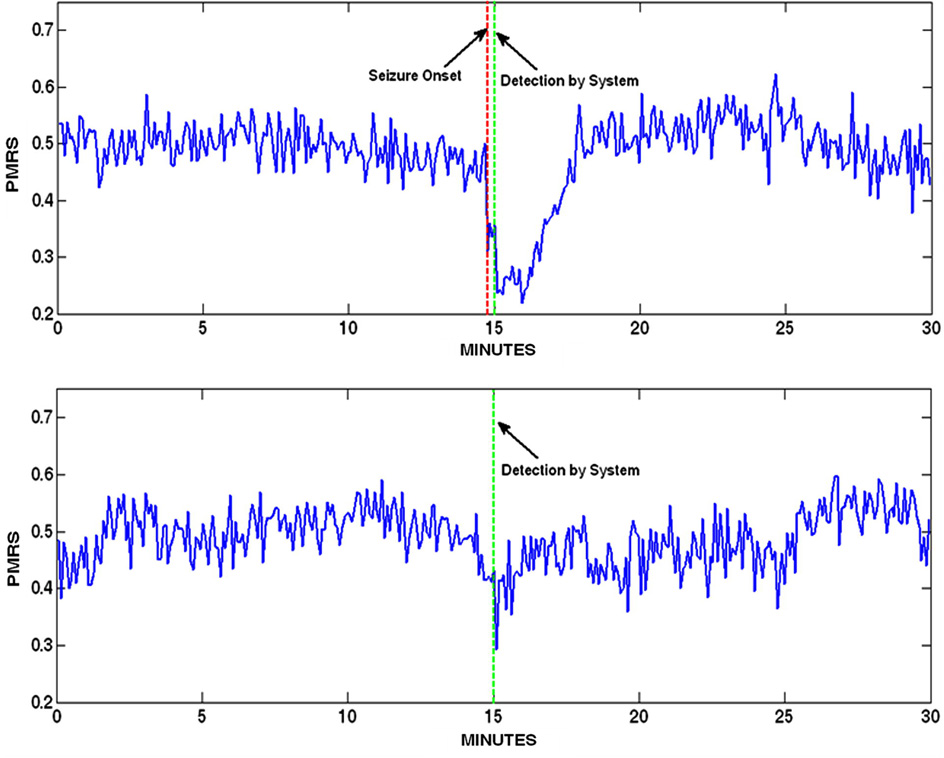
Methods: The test seizure detection system, IdentEvent™, was developed to enhance the efficiency of post-hoc long-term EEG review in epilepsy monitoring units. It translates multi-channel scalp EEG signals into multiple EEG descriptors and recognizes ictal EEG patterns. Detection criteria and thresholds were optimized in 47 long-term scalp EEG recordings selected for training (47 subjects, ∼3653h with 141 seizures). The detection performance of IdentEvent was evaluated using a separate test dataset consisting of 436 EEG segments obtained from 55 subjects (∼1200h with 146 seizures). Each of the test EEG segments was reviewed by three independent epileptologists and the presence or absence of seizures in each epoch was determined by majority rule. Seizure detection sensitivity and false detection rate were calculated for IdentEvent as well as for the comparable detection software (Persyst's Reveal®, version 2008.03.13, with three parameter settings). Bootstrap re-sampling was applied to establish the 95% confidence intervals of the estimates and for the performance comparison between two detection algorithms.
Results: The overall detection sensitivity of IdentEvent was 79.5% with a false detection rate (FDR) of 2 per 24h, whereas the comparison system had 80.8%, 76%, and 74% sensitivity using its three detection thresholds (perception score) with FDRs of 13, 8, and 6 per 24h, respectively. Bootstrap 95% confidence intervals of the performance difference revealed that the two detection systems had comparable detection sensitivity, but IdentEvent generated a significantly (p<0.05) smaller FDR.
Conclusions: The study validates the performance of the IdentEvent™ seizure detection system.
Significance: With comparable detection sensitivity, an improved false detection rate makes the automated seizure detection software more useful in clinical practice.
Copyright © 2010 International Federation of Clinical Neurophysiology. Published by Elsevier Ireland Ltd. All rights reserved.
Figures


Similar articles
-
Automatic seizure detection in long-term scalp EEG using an adaptive thresholding technique: a validation study for clinical routine.Clin Neurophysiol. 2014 Jul;125(7):1346-52. doi: 10.1016/j.clinph.2013.12.104. Epub 2014 Jan 7. Clin Neurophysiol. 2014. PMID: 24462506
-
Seizure detection using scalp-EEG.Epilepsia. 2018 Jun;59 Suppl 1:14-22. doi: 10.1111/epi.14052. Epilepsia. 2018. PMID: 29873826 Review.
-
Seizure detection by convolutional neural network-based analysis of scalp electroencephalography plot images.Neuroimage Clin. 2019;22:101684. doi: 10.1016/j.nicl.2019.101684. Epub 2019 Jan 22. Neuroimage Clin. 2019. PMID: 30711680 Free PMC article.
-
Visual seizure annotation and automated seizure detection using behind-the-ear electroencephalographic channels.Epilepsia. 2020 Apr;61(4):766-775. doi: 10.1111/epi.16470. Epub 2020 Mar 11. Epilepsia. 2020. PMID: 32160324 Free PMC article.
-
Structured testing during seizures: A practical guide for assessing and interpreting ictal and postictal signs during video EEG long term monitoring.Seizure. 2019 Nov;72:13-22. doi: 10.1016/j.seizure.2019.08.008. Epub 2019 Aug 31. Seizure. 2019. PMID: 31546090 Review.
Cited by
-
Selection of optimum frequency bands for detection of epileptiform patterns.Healthc Technol Lett. 2019 Jul 26;6(5):126-131. doi: 10.1049/htl.2018.5051. eCollection 2019 Oct. Healthc Technol Lett. 2019. PMID: 31839968 Free PMC article.
-
Electroencephalogram Monitoring in Critical Care.Semin Neurol. 2020 Dec;40(6):675-680. doi: 10.1055/s-0040-1719073. Epub 2020 Nov 11. Semin Neurol. 2020. PMID: 33176375 Free PMC article. Review.
-
A Full-Stack Application for Detecting Seizures and Reducing Data During Continuous Electroencephalogram Monitoring.Crit Care Explor. 2021 Jul 13;3(7):e0476. doi: 10.1097/CCE.0000000000000476. eCollection 2021 Jul. Crit Care Explor. 2021. PMID: 34278312 Free PMC article.
-
Classification of epileptic seizures using wavelet packet log energy and norm entropies with recurrent Elman neural network classifier.Cogn Neurodyn. 2017 Feb;11(1):51-66. doi: 10.1007/s11571-016-9408-y. Epub 2016 Sep 12. Cogn Neurodyn. 2017. PMID: 28174612 Free PMC article.
-
Deep anomaly detection of seizures with paired stereoelectroencephalography and video recordings.Sci Rep. 2021 Apr 5;11(1):7482. doi: 10.1038/s41598-021-86891-y. Sci Rep. 2021. PMID: 33820942 Free PMC article.
References
-
- Cohen J. A coefficient of agreement for nominal scales. Educ Psychol Meas. 1960;20(1):37–46.
-
- Durkalski VL, Palesch YY, Lipsitz SR, Rust PF. Analysis of clustered matched-pair data for a non-inferiority study design. Stat Med. 2003;22:279–290. - PubMed
-
- Efron B, Tibshirani RJ. An Introduction to the Bootstrap. Boca Raton: Chapman & Hall/CRC; 1994.
-
- Founta KN, Smith R. A novel closed-loop stimulation system in the control of focal, medically refractory epilepsy. Acta Neurochir Suppl. 2007;97(2):357–362. - PubMed
-
- Hopfengärtner R, Kerling F, Bauer V, Stefan H. An efficient, robust and fast method for the offline detection of epileptic seizures in long-term scalp EEG recordings. Clin Neurophysiol. 2007;118:2332–2343. - PubMed
Publication types
MeSH terms
Grants and funding
LinkOut - more resources
Full Text Sources
Medical
