. 2010 May 13;66(3):403-16.
doi: 10.1016/j.neuron.2010.04.008.

Neurexins physically and functionally interact with GABA(A) receptors

Affiliations

Neurexins physically and functionally interact with GABA(A) receptors

Chen Zhang et al. Neuron. .

Abstract

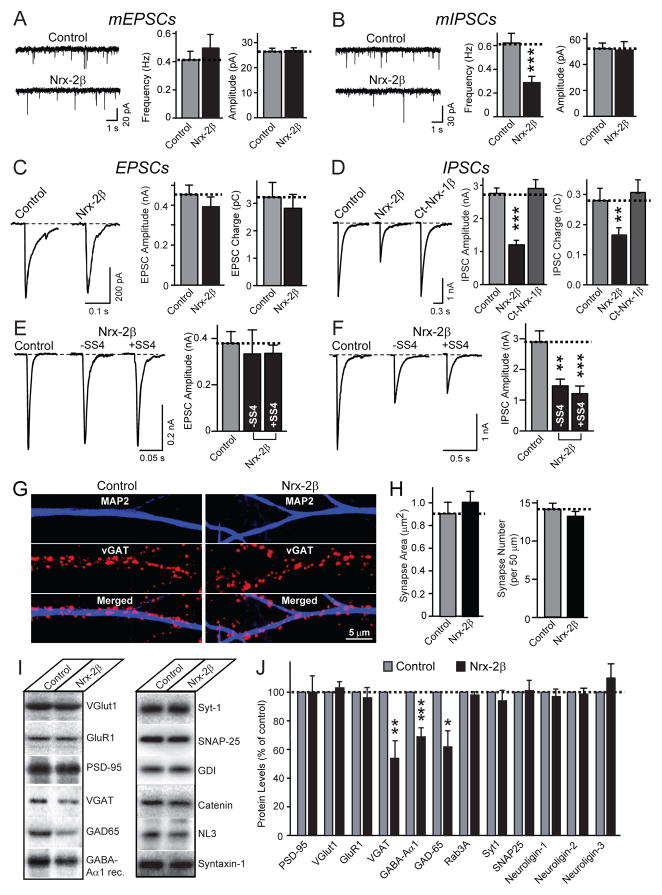
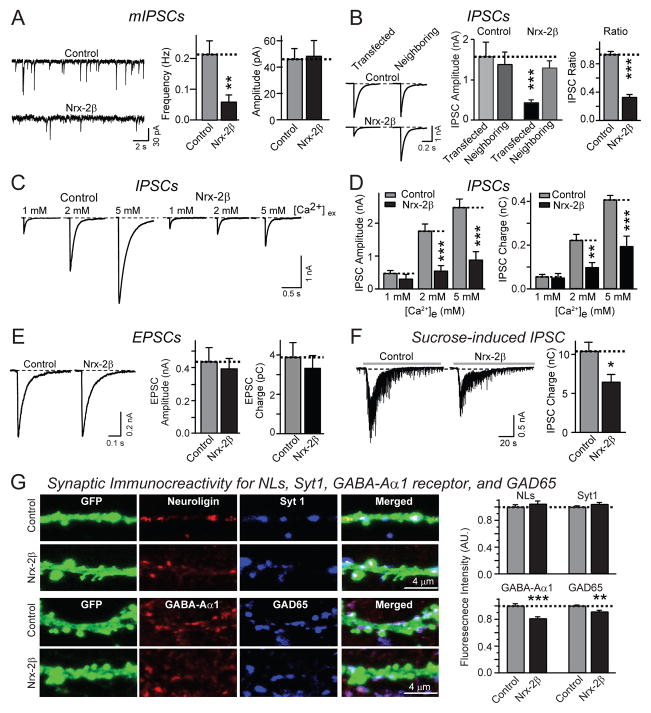
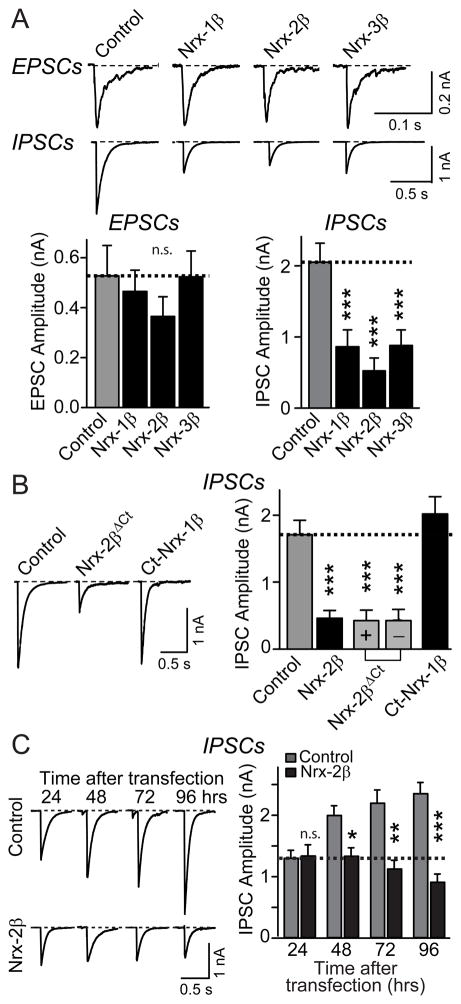
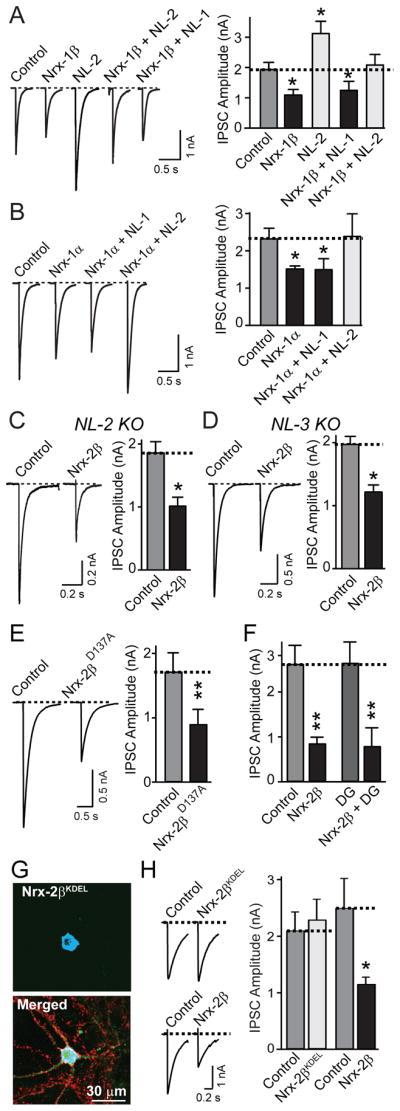
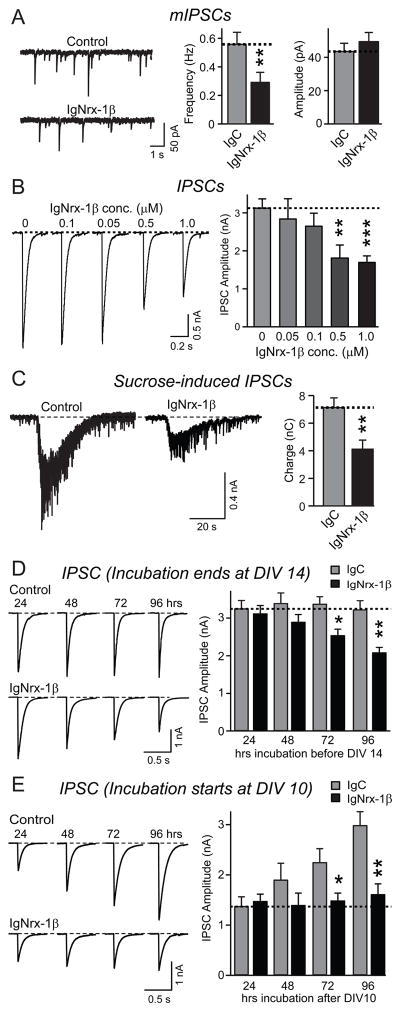
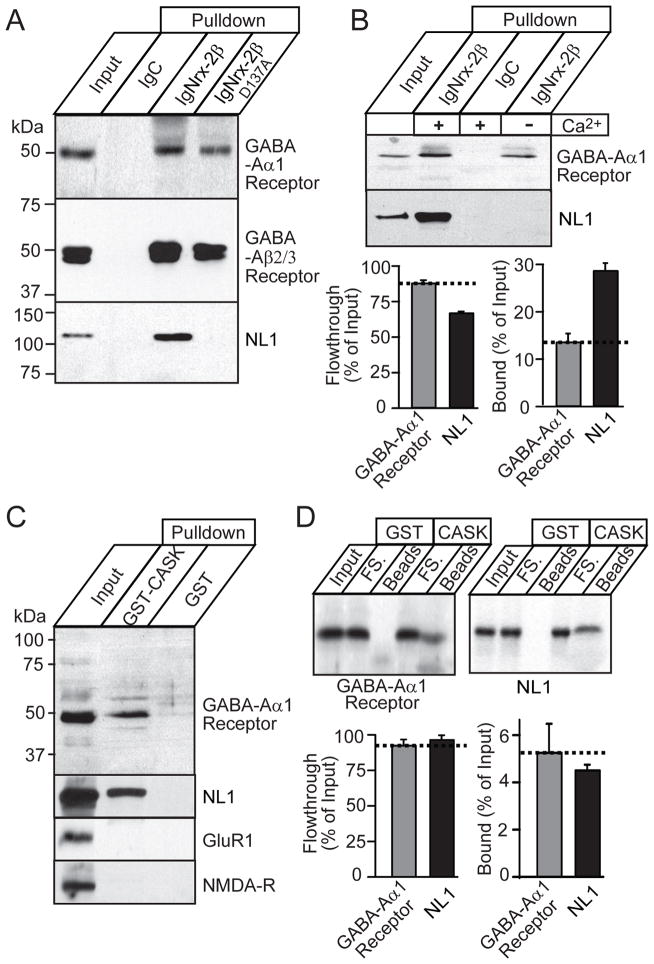
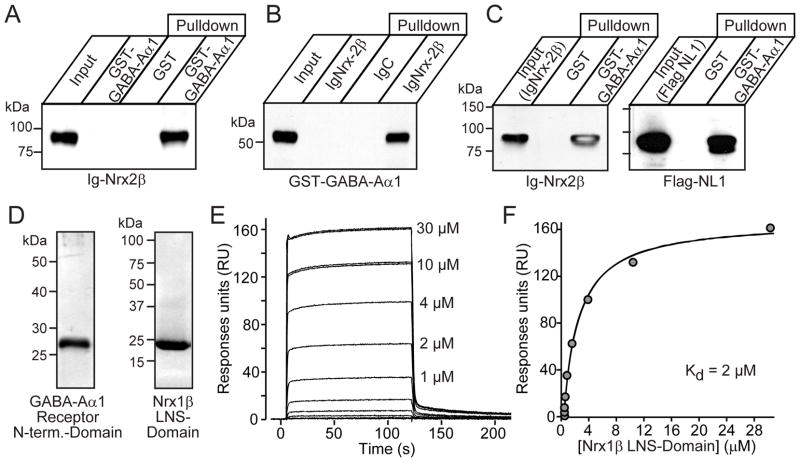
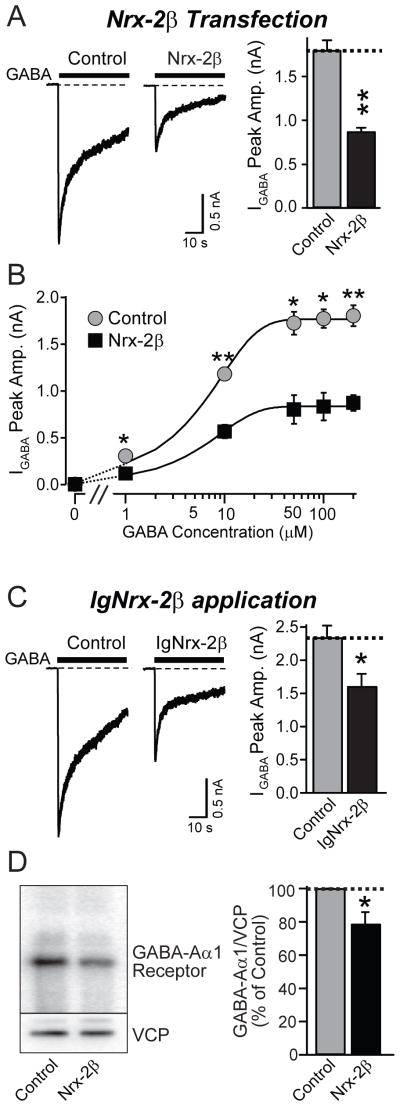
Neurexins are presynaptic cell-adhesion molecules that form trans-synaptic complexes with postsynaptic neuroligins. When overexpressed in nonneuronal cells, neurexins induce formation of postsynaptic specializations in cocultured neurons, suggesting that neurexins are synaptogenic. However, we find that when overexpressed in neurons, neurexins do not increase synapse density, but instead selectively suppressed GABAergic synaptic transmission without decreasing GABAergic synapse numbers. This suppression was mediated by all subtypes of neurexins tested, in a cell-autonomous and neuroligin-independent manner. Strikingly, addition of recombinant neurexin to cultured neurons at submicromolar concentrations induced the same suppression of GABAergic synaptic transmission as neurexin overexpression. Moreover, experiments with native brain proteins and purified recombinant proteins revealed that neurexins directly and stoichiometrically bind to GABA(A) receptors, suggesting that they decrease GABAergic synaptic responses by interacting with GABA(A) receptors. Our findings suggest that besides their other well-documented interactions, presynaptic neurexins directly act on postsynaptic GABA(A) receptors, which may contribute to regulate the excitatory/inhibitory balance in brain.


Figures

Figure 1
Figure 1. Lentivirally expressed neurexin-2β decreases GABAergic but not glutamatergic synaptic strength
All data are from cultured hippocampal neurons infected with lentivirus expressing EGFP only (control), or co-expressing EGFP with neurexin-2β lacking an insert in splice site 4 (Nrx-2β), or other versions of neurexin-2β as specified. A. and B. Representative traces (left) and summary graphs of the frequency (center) and amplitudes (right) of mEPSCs (A) or mIPSCs (B) recorded in 1 μM tetrodotoxin (TTX) and 0.1 mM picrotoxin (A) or 10 μM CNQX (B) (mEPSCs: control: n=25 cells/3 cultures; Nrx-2β: n=26/3; mIPSCs: control: n=29/3; Nrx-2β: n=27/3). C. and D. Representative traces (left) and summary graphs of the amplitude (center) and synaptic charge transfer (right, integrated over 0.2 s) of action potential-evoked EPSCs recorded in 0.1 mM picrotoxin (C) or IPSCs recorded in 10 μM CNQX (D; N-terminally truncated neurexin-1β [Ct-Nrx-1β] was included as additional negative control)(EPSCs: control: n=54/8; Nrx-2β: n=59/8; IPSCs: control: n=12/3; Nrx-2β: n=13/3; Ct-Nrx-1β: n=15/3). E. and F. Representative traces (left) and summary graphs of the amplitudes (right) of EPSCs (E) and IPSCs (F) in neurons infected with control lentivirus, or lentivirus expressing neurexin-2β without (−SS4) and with an insert in splice site 4 (+SS4), recorded as described for C and D (EPSCs: control, n=11/2; Nrx-2β +SS4, n=11/2; Nrx-2β −SS4, n=11/2. IPSCs: control, n=50/8; Nrx-2β +SS4, n=51/8; Nrx-2β −SS4, n=46/8). G. Representative images of neurons infected with control and neurexin-2β expressing lentiviruses stained for MAP2 and the vesicular GABA transporter vGAT. H. Quantitation of synapse area (left) and density (right) in the experiments described in G (control: n=29/3; Nrx-2β: n=40/3). I. and J. Representative immunoblots (F) and summary graphs of protein levels (G) measured in lysates of cultured hippocampal neurons infected with control or Nrx-2β expressing lentivirus. Protein levels were measured by quantitative immunoblotting with 125I-labled secondary antibodies and phosphoImager detection (n=3–5 cultures). For all representative traces and images, scale bars apply to all panels in a set. All summary graphs show means ± SEMs; statistical comparisons were made by Student’s t-test (*=p<0.05, **=p<0.01, ***=p<0.001). For additional data, see Fig. S1.
Figure 2
Figure 2. Postsynaptic expression of neurexin-2β impairs inhibitory synaptic strength
All data are from cultured hippocampal neurons co-transfected with an EGFP expression plasmid and either an empty vector (control), or a vector encoding neurexin-2β (Nrx-2β). A. Representative traces (left), and summary graphs of the mean frequency (center) and amplitudes (right) of mIPSCs recorded in 1 μM TTX and 10 μM CNQX (control: n=26/3; Nrx-2β: n=24/3). B. Representative traces (left), mean amplitudes (center), and IPSC ration (right) of IPSCs recorded from neighboring transfected and non-transfected neurons (control: n=11 pairs/3 cultures; Nrx-2β: n=12 pairs/3 cultures). C. and D. Representative traces (C) and summary graphs of the amplitudes (D left) and synaptic charge transfer (D right) of IPSCs recorded in 1, 2 and 5 mM extracellular Ca2+ (control: n=17/3, 17/3 and 20/3 at 1, 2 and 5 mM extracellular Ca2+; Nrx-2β: n=17/3, 18/3 and 23/3 at 1, 2 and 5 mM Ca2+). E. Representative traces (left), mean amplitudes (center), and mean charge transfer (right) of EPSCs recorded from control or neurexin-2β transfected neurons in the presence of 10 μM picrotoxin (control: n=28/4; Nrx-2β: n=32/4). F. Representative traces (left) and mean charge transfer (right; integrated over 60 s) of IPSCs elicited by hypertonic sucrose (0.5 M for 30 s; control: n=36/8; Nrx-2β: n=42/8). G. Measurement of synaptic signals for neuroligins and GABA-Aα1 receptors in neurons expressing neurexin-2β. Transfected neurons were stained with a pan-neuroligin antibody (Song et al., 1998) and synaptotagmin-1 (Syt1), or for GABA-Aα1 receptors and GAD65. Panels show representative images (left) and quantitations of the staining intensity per synapse for all four markers (right). For all representative data, scale bars apply to all panels in a set. All summary graphs show means ± SEMs; statistical comparisons by Student’s t-test yielded: n.s.=non-significant, *=p<0.05; **=p<0.01, ***=p<0.001. For additional data, see Fig. S2.
Figure 3
Figure 3. Extracellular sequences of neurexins mediate decrease of IPSCs
Different neurexins were examined in transfected cultured hippocampal neurons as described for Fig. 2. A. Representative traces (top) and mean amplitudes (bottom) of EPSCs and IPSCs recorded from neurons transfected with control vector or vectors encoding neurexin-1β (Nrx-1β), -2β (Nrx-2β), or -3β (Nrx-3β; EPSCs: control, n=30/4; Nrx-1β, n=31/4; Nrx-2β, n=28/4; Nrx-3β, n=29/4. IPSCs: control, n=42/4; Nrx-1β, n=23/3; Nrx-2β, n=48/4; Nrx-3β, n=21/3). B. Representative traces (left) and mean amplitudes of IPSCs (right) recorded from neurons transfected with control vector or vectors expressing wild-type neurexin-2β (Nrx-2β), C-terminally truncated neurexin-2β (Nrx-2βΔCt) composed of its extracellular sequences and transmembrane region with (+) and without (-) an insert in splice site 4, or N-terminally truncated neurexin-1β (Ct-Nrx-1β) composed of only its transmembrane region and cytoplasmic tail (control: n=32/5; Nrx-2β: n=52/5; Nrx-2βΔCt without SS4: n=32/5; Nrx-2βΔCt with SS4: n=24/4; Ct-Nrx-1β: n=42/3). C. Representative traces (left) and mean amplitudes (right) of IPSCs recorded from neurons transfected with control or neurexin-2β expressing vectors on DIV10, and analyzed at the indicated times after transfection (for all times tested: control, n= 5/3, Nrx-2β, n=15/3). For all representative traces, scale bars apply to all traces in a set. All summary graphs show means ± SEMs; statistical comparisons by Student’s t-test yielded: n.s.=non-significant, *=p<0.05; **=p<0.01, ***=p<0.001. For additional data, see Fig. S3.
Figure 4
Figure 4. Neurexins impair IPSCs independent of neuroligins
Hippocampal neurons transfected with the indicated combinations of expression vectors were analyzed as described for Fig. 2. A. Representative traces (left) and mean amplitudes (right) of IPSCs recorded from neurons transfected with control vector, or vectors expressing only neurexin-1β (Nrx-1β), only neuroligin-2 (NL2), neurexin-1β together with neuroligin-2 (Nrx-1β + NL2), or neurexin-1β with neuroligin-1 (Nrx-1β + NL1; control: n=42/5; Nrx-1β: n=55/5; Nrx-1β + NL-1: n=26/4; Nrx-1β + NL-2: n=25/4; NL-2: n=9/1). B. Representative traces (left) and mean amplitudes (right) of IPSCs recorded from neurons transfected with control vector, or vectors expressing only neurexin-1α (Nrx-1α), or together with neuroligin-2 (Nrx-1α + NL2), or only neuroligin-1 (Nrx-1α + NL1; control: n=48/5; Nrx-1α: n=38/5; Nrx-1α + NL-1: n=19/3; Nrx-1α + NL-2: n=16/3). C and D. Representative traces (left) and mean amplitudes (right) of IPSCs recorded from neurons cultured from neuroligin-2 KO (C) or neuroligin-3 KO mice (D), and transfected with control vector or neurexin-2β (Nrx-2β; C, control: n=20/3; Nrx-2β: n=19/3; D, n = 9 pairs of neighboring non-transfected and transfected neurons/3 cultures). E. Representative traces (left) and mean amplitudes (right) of IPSCs recorded from neighboring non-transfected and transfected neurons expressing mutant neurexin-2β (Nrx-2βD137A) in which a point mutation abolishes Ca2+- and neuroligin-binding to the neurexin-2β LNS-domain (control: n= 15 pairs/3 cultures). F. Mean amplitudes of IPSCs recorded from neurons transfected with control vector, or vectors expressing neurexin-2β alone (Nrx-2β), neurexin-2β together with dystroglycan (Nrx-2β + DG), or dystroglycan alone (DG; control: n=16/3; Nrx-2β: n=11/3; Nrx-2β + DG: n=16/3; DG: n=12/2). G. and H. Truncated neurexin-2β with a C-terminal KDEL sequence is retained in the ER (G) and unable to decrease IPSCs (H). G depicts representative images of neurons demonstrating that neurexin-2βKDEL is retained in the ER (Nrx-2βKDEL; visualized via a myc-epitope; top); colabeling for synapsin in the merged image reveals that the neuron nevertheless forms abundant synapses (Merged; bottom). H (left, representative traces; right, summary graphs) show that an ER-retained neurexin-2β mutant that still binds neuroligin (Fig. S4) has no effect on IPSC amplitudes (Nrx-2βKDEL transfection; control: n=14/3; Nrx-2βKDEL: n=13/3; Nrx-2β transfection; control: n=8/3; Nrx-2β: n=8/3). For all representative traces, scale bars apply to all traces in a set. Summary graphs show means ± SEMs; statistical comparisons by Student’s t-test yielded: *=p<0.05; **=p<0.01. For additional data, including postsynaptic knockdowns of neurexins, see Fig. S4.
Figure 5
Figure 5. Recombinant neurexin-1β in medium inhibits IPSCs
All data are from cultured hippocampal neurons incubated with purified control Ig-fusion protein (IgC) or neurexin-1β Ig-fusion protein containing the extracellular domains of neurexin-1β (IgNrx-1β). Except where noted, neurons were treated for 96 h at 37 °C with 1 μM protein. A. Representative traces (left) and summary graphs of the frequency (center) and amplitudes (right) of mIPSCs monitored in 1 μM TTX and 10 μM CNQX (IgC: n=19/3; IgNrx-1β: n=19/3). B. Representative traces (left) and mean amplitudes (right) of evoked IPSCs recorded from neurons incubated with the indicated concentrations of IgNrx-1β (control: n=17/3; 1 μM: n=12/3; 500 nM: n=13/3; 100 nM: n=7/3; 50 nM: n=7/3). C. Representative traces (left) and mean charge transfer (right) of IPSCs elicited by hypertonic sucrose (0.5 M for 30 s; IgC: n=14/3; IgNrx-1β: n=15/3). D. Representative traces (left) and mean amplitudes (right) of evoked IPSCs recorded from neurons treated with IgC or IgNrx-1β for the indicated times, with all incubations ending at DIV14 (24 h: control, n=19/3, IgNrx-1β: n=14/3; 48 h: control, n=14/3, IgNrx-1β: n=15/3; 72 h: control, n=19/3, IgNrx-1β: n=19/3; 96 h: control, n=14/3, IgNrx-1β: n=15/3). E. Representative traces (left) and mean amplitudes (right) of evoked IPSCs recorded from neurons treated with IgC or IgNrx-1β for the indicated times after the incubations were started at DIV10 (24 h: control, n=24/4, IgNrx-1β: n=26/4; 48 h: control, n=18/3, IgNrx-1β: n=18/3; 72 h: control, n=18/3, IgNrx-1β: n=22/3; 96 h: control, n=18/3, IgNrx-1β: n=18/3). For all representative traces, scale bars apply to all traces in a set. All summary graphs show means ± SEMs; statistical comparisons by Student’s t-test yielded: n.s.=non-significant, *=p<0.05; **=p<0.01, ***=p<0.001. For additional data, see Fig. S5.
Figure 6
Figure 6. Neurexins form a complex with GABAA-receptors
All data shown are from affinity chromatography experiments using immobilized Ig- or GST-fusion proteins and Triton X-100 solubilized rat brain proteins. A. Affinity purification of GABAA-receptors on neurexin-2β. Immobilized IgC or Ig-fusion proteins of the extracellular sequences of wild-type neurexin-2β (IgNrx-2β) or of neurexin-2β with a Ca2+-binding site point mutation that blocks neuroligin-binding (IgNrx-2βD137A) were used as affinity matrices for rat brain proteins solubilized in Triton X-100. Bound proteins were analyzed by immunoblotting for GABAAα1- and GABAAβ2/3-receptors and neuroligin-1. B. Quantitative, Ca2+-independent binding of GABAAα1-receptor to IgNrx-2β. Solubilized rat brain proteins were bound to IgNrx-2β or IgC in the presence of 2.5 mM Ca2+, or of 0 mM Ca2+ plus 5 mM EDTA. Bound proteins were analyzed by immunoblotting for GABAAα1-receptor and neuroligin-1 (NL1) with ECL detection (top), and additionally quantified for the Ca2+-containing experiments with 125I-labeled secondary antibodies and phosphoImager detection (bottom; means ± SEMs, n=8). C. Affinity chromatography of brain proteins on immobilized GST-CASK containing the CASK PDZ-domain (GST-CASK), or on GST alone. Bound proteins were analyzed by immunoblotting for GABAAα1-receptor, neuroligin-1 (NL1), GluR1, and NMDA-receptor (NMDA-R). D. Quantitation of the binding of endogenous brain GABAAα1-receptor and neuroligin-1 (NL1) to immobilized GST-CASK or GST. Bound proteins were analyzed by immunoblotting with 125I-labeled secondary antibodies and phosphoimager detection; top panels show a representative blot, and bottom panels summary graphs (means ± SEMs; n=6). For additional raw data and controls, see Fig. S6.
Figure 7
Figure 7. Neurexins directly bind to GABAAα1-receptors
All data shown analyze binding of purified recombinant proteins. A and B. Binding of purified GST or a GST-fusion protein of the N-terminal domain of rat GABAAα1-receptor to Ig-control (IgC) or Ig-neurexin-2β fusion proteins (IgNrx-2β), analyzed either by immobilizing the GST-fusion proteins and measuring binding of IgNrx-2β (A), or immobilizing the Ig-fusion proteins and measuring binding of GST-GABAAα1 (B). Binding was visualized by immunoblotting as indicated. C. Binding of recombinant flag-tagged neuroligin-1 (NL1) to immobilized GST-GABAAα1 receptors by forming a tripartite complex with neurexin-2β. Immobilized GST or the GST-GABAAα1 fusion protein were incubated with both neurexin-2β and neuroligin-1, and bound proteins were analyzed by immunopblotting for neurexin-2β (left) or neuroligin-1 (right). D. SDS-gels of purified proteins used for binding affinity measurements (left: silver-stained gel of the purifed recombinant GABAAα1-receptor N-terminal domain; right: Coomassie-stained gel of the purified neurexin-1β LNS-domain). E. Surface-plasmon resonance sensorgrams showing the binding of neurexin-1β to the extracellular N-terminal domain of the GABAAα1-receptor. Each line corresponds to the indicated concentration of neurexin-1 β injected onto the immobilized GABAAα1-receptor surface. The sensorgrams demonstrate a concentration-dependent association as expected for a bimolecular association. F. Surface-plasmon resonance quantitation of the binding of neurexin-1β to the N-terminal domain of the GABAAα1-receptor. The maximum steady-state binding of neurexin-1β to the GABAAα1-receptor is plotted as a function of the neurexin-1β concentration. Dissociation constants were calculated by tting the curve to a single-site binding model. Each data point was measured twice, and both measurements are shown on the gure, but overlap with each other. The experiment was repeated with higher GABAAα1-receptor immobilization on the chip surface, and similar affinities were obtained (not shown). For additional data, see Fig. S7.
Figure 8
Figure 8. Neurexin-2β impairs GABAAα1-receptor function in transfected HEK293 cells
A. Representative traces (left) and peak amplitudes (right) of currents induced by application of 0.2 mM GABA to HEK293 cells stably expressing GABAA-receptors (α1β2γ2, CRL-2029 from ATCC), and transfected with pCMV5 (control) or vector expressing neurexin-2β (control: n=18/3; Nrx-2β: n=18/3). B. Plot of the current amplitude induced as described in A. as a function of the GABA concentration (control: n=19/4; Nrx-2β: n=17/4). For a scaled plot to document a lack of change in apparent GABA-affinity, see Suppl. Fig. 12. C. Representative traces (left) and peak amplitudes (right) of currents induced by application of 0.2 mM GABA to HEK293 cells stably expressing GABAA receptors that had been incubated for 48 h with 1 μM control IgC or IgNrx-2β (control: n=15/3; IgNrx-2β: n=16/3). D. Quantitation of the levels of GABAAα1-receptor in HEK293 cells that stably express GABAA-receptors, and were transfected with either an empty vector (control), or a vector encoding neurexin-2β (Nrx-2β) (n= 13 independent cultures). For all representative traces, scale bars apply to all traces in a set. All summary graphs show means ± SEMs; statistical comparisons by Student’s t-test yielded *=p<0.05; **=p<0.01, ***=p<0.001. For additional data, see Fig. S8.

References

    1. Araç D, Boucard AA, Özkan E, Strop P, Newell E, Südhof TC, Brunger AT. Structures of Neuroligin-1 and the Neuroligin-1/β-Neurexin-1 complex reveal specific protein-protein and protein-Ca2+ interactions. Neuron. 2007;56:992–1003. - PubMed
    1. Baumgartner S, Littleton JT, Broadie K, Bhat MA, Harbecke R, Lengyel JA, Chiquet-Ehrismann R, Prokop A, Bellen HJ. A Drosophila neurexin is required for septate junction and blood-nerve barrier formation and function. Cell. 1996;87:1059–1068. - PubMed
    1. Biswas S, Russell RJ, Jackson CJ, Vidovic M, Ganeshina O, Oakeshott JG, Claudianos C. Bridging the synaptic gap: neuroligins and neurexin I in Apis mellifera. PLoS ONE. 2008;3:e3542. - PMC - PubMed
    1. Boucard AA, Chubykin AA, Comoletti D, Taylor P, Südhof TC. A splice code for trans-synaptic cell adhesion mediated by binding of neuroligin 1 to α- and β-neurexins. Neuron. 2005;48:229–236. - PubMed
    1. Chih B, Afridi SK, Clark L, Scheiffele P. Disorder-associated mutations lead to functional inactivation of neuroligins. Hum Mol Genet. 2004;13(14):1471–1477. - PubMed

Publication types

MeSH terms

LinkOut - more resources