. 2010 May 14;38(3):452-64.
doi: 10.1016/j.molcel.2010.02.032.

Ring1B compacts chromatin structure and represses gene expression independent of histone ubiquitination

Affiliations

Ring1B compacts chromatin structure and represses gene expression independent of histone ubiquitination

Ragnhild Eskeland et al. Mol Cell. .

Abstract

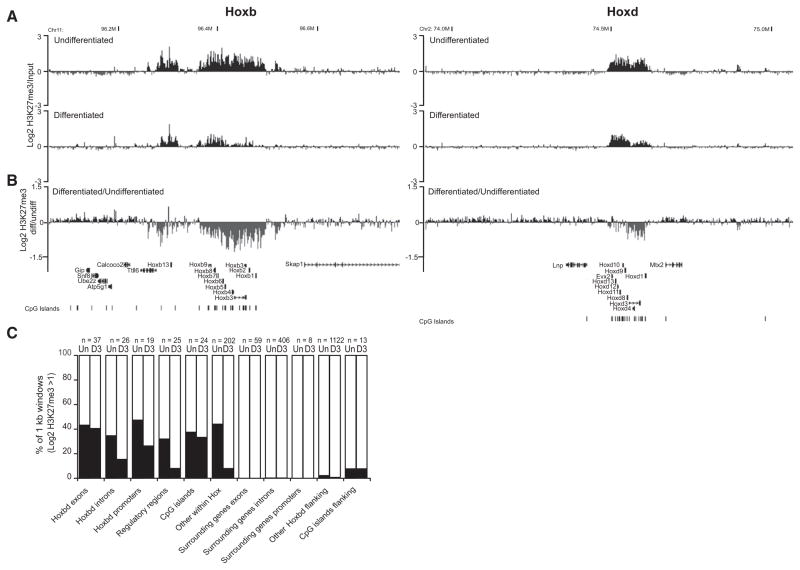
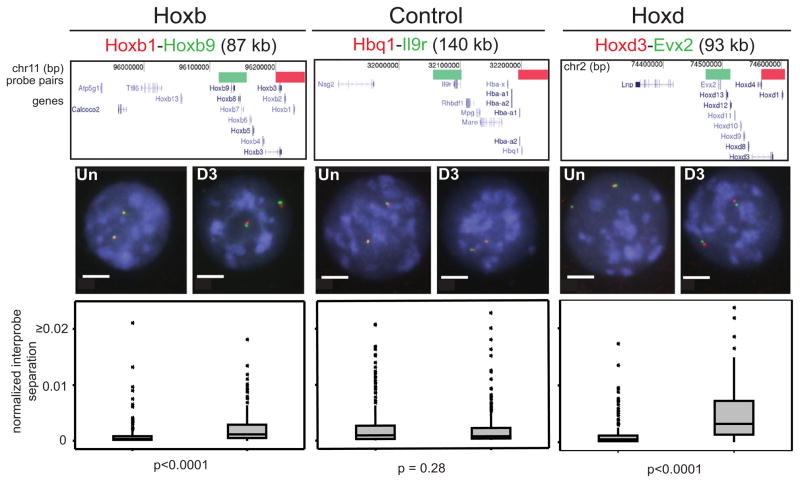
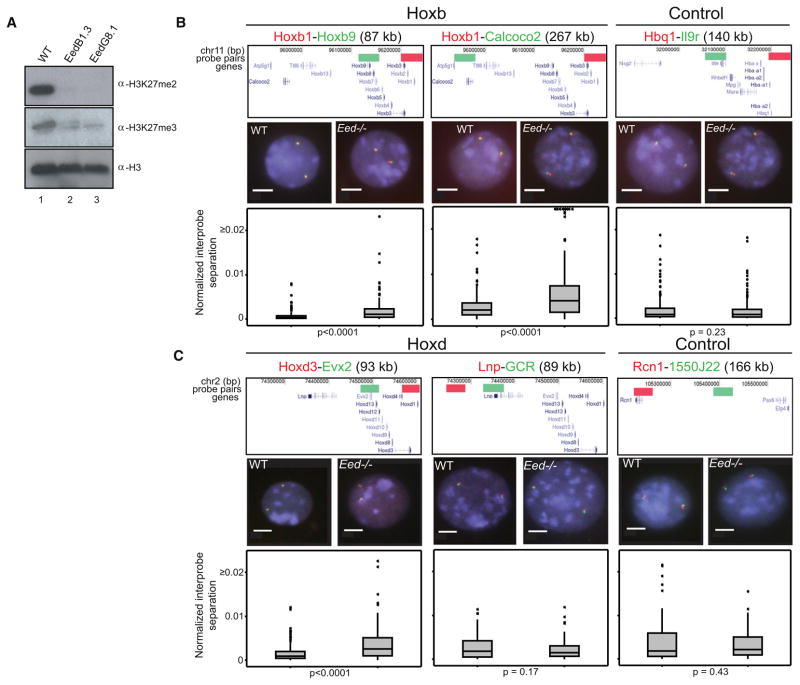
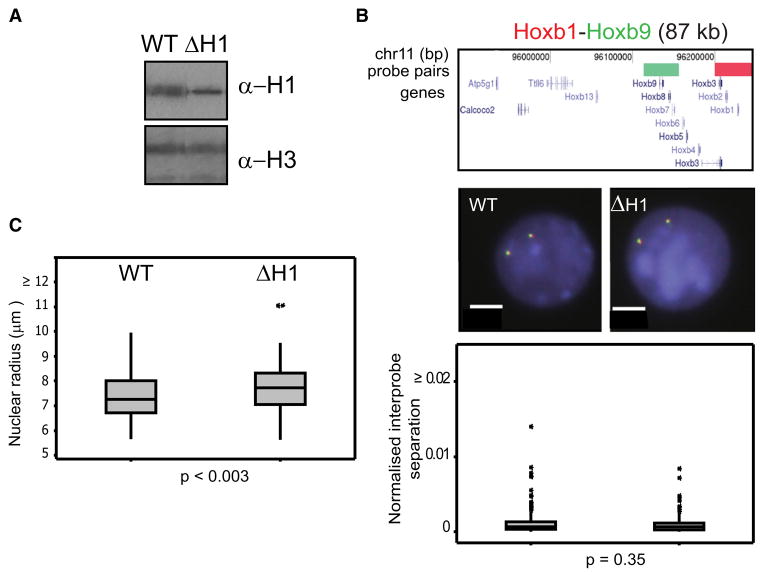
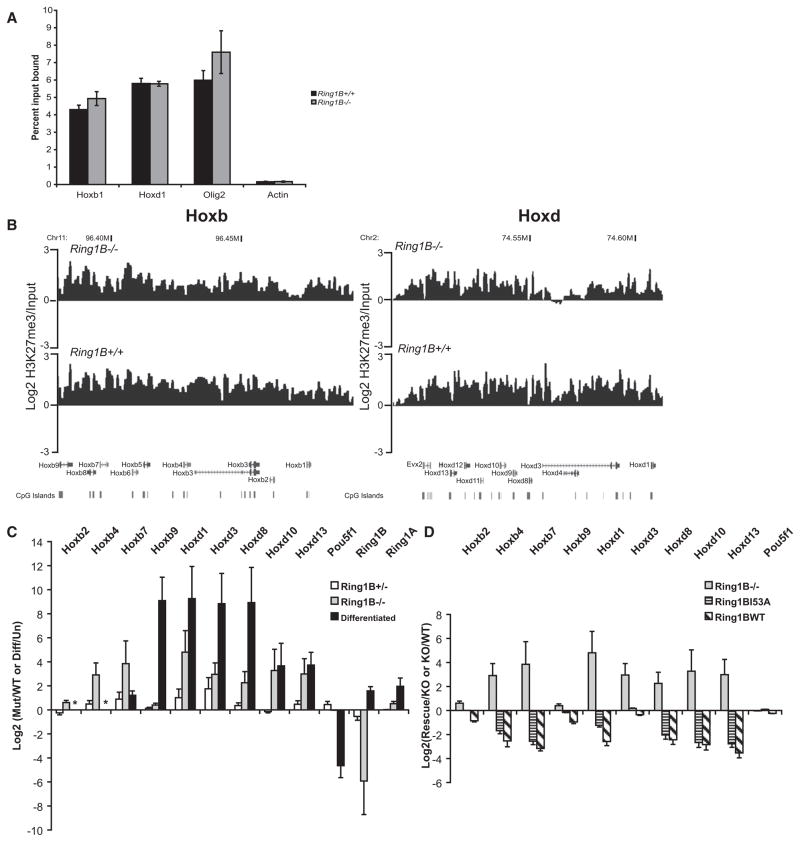
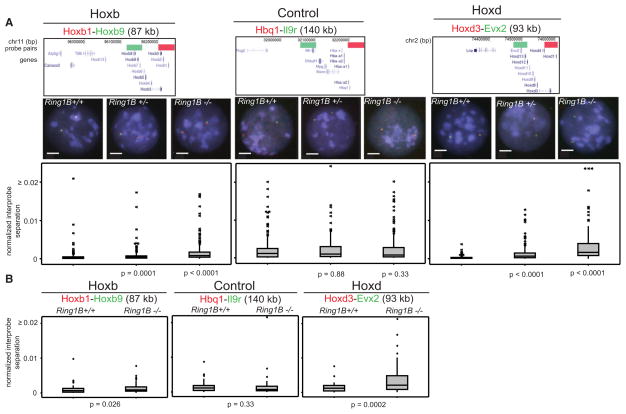
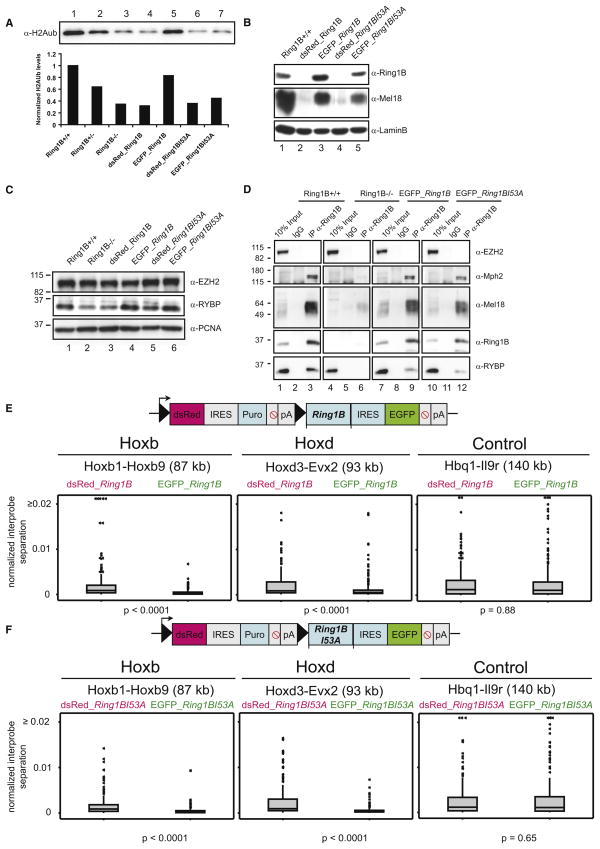
How polycomb group proteins repress gene expression in vivo is not known. While histone-modifying activities of the polycomb repressive complexes (PRCs) have been studied extensively, in vitro data have suggested a direct activity of the PRC1 complex in compacting chromatin. Here, we investigate higher-order chromatin compaction of polycomb targets in vivo. We show that PRCs are required to maintain a compact chromatin state at Hox loci in embryonic stem cells (ESCs). There is specific decompaction in the absence of PRC2 or PRC1. This is due to a PRC1-like complex, since decompaction occurs in Ring1B null cells that still have PRC2-mediated H3K27 methylation. Moreover, we show that the ability of Ring1B to restore a compact chromatin state and to repress Hox gene expression is not dependent on its histone ubiquitination activity. We suggest that Ring1B-mediated chromatin compaction acts to directly limit transcription in vivo.


Figures

Figure 1
Figure 1. Loss of H3K27me3 at Hox Loci during ESC Differentiation
(A) Log2 H3K27me3/input at Hoxb (left) and Hoxd (right), by microarray hybridization of ChIPed material from undifferentiated (top) and differentiated (bottom) OS25 ESCs. Running mean of three biological and two technical replicates (n = 6) with 1 kb window size and a 1 kb increment is shown. (B) Log2 differentiated/undifferentiated H3K27me3. Map position (Mb) and RefSeq gene annotations are from the August 2005 (mm7) Build 35 assembly of the mouse genome (http://genome.ucsc.edu). (C) Percent of 1 kb running mean windows with log2 H2K27me3/input >1 in undifferentiated (Un) and differentiated (D3) ESCs for different categories of probes from the tiling array, either within Hox clusters (Hox exons, introns, promoters, CpG islands, known regulatory regions, and other) or in flanking regions (surrounding exons, introns, promoters, CpG islands, and other probes).
Figure 2
Figure 2. Chromatin Decompaction within Hox Loci during Differentiation
FISH with probe pairs at Hoxb, Hoxd, and a control locus on MMU 11, in MAA-fixed nuclei of undifferentiated (Un) and differentiated (D3) OS25 ESCs counter-stained with DAPI (blue). Scale bar = 5 μm. Above the images, diagrams show the positions of probes in the UCSC browser (February 2006 Assembly, mm8 Build 36). Genome position is shown in bp. Below the images, box plots show the distribution of interprobe distances2 (d2) normalized for nuclear radius2 (r2) for Un and D3 cells. The shaded boxes show the median and interquartile range of the data; asterisks indicate outliers. n = 2 × biological replicates, each of 100 loci. The statistical significance of differences between Un and D3 were examined by Mann-Whitney U tests.
Figure 3
Figure 3. Chromatin Decompaction at Hox Loci in the Absence of Eed
(A) Western blot of H3K27me2 and me3 in Eed−/− (Lane 2 and 3) and matched wild-type (WT) ESCs (Lane 1). Levels of H3 are shown for comparison. Weak H3K27me3 signal in Eed−/− lanes is due to remnant feeder cells. (B and C) 2D FISH with probe pairs at Hoxb and a control locus on MMU 11 n = 2 biological replicates, each of 100 loci (B), and probes across the Hoxd locus (n = 200 loci) or 5′ flanking the Hox cluster and a control locus on MMU 2 (n = 100 loci each) (C), in nuclei of WT (left) and Eed−/− (right) cells counterstained with DAPI (blue). Scale bar = 5 μm. Probe position and the distribution of normalized interprobe distances for WT and Eed−/− cells are indicated as in Figure 2A.
Figure 4
Figure 4. Chromatin Compaction in H1-Depleted Cells
(A) Western blot showing reduced levels of H1 in ΔH1 compared to WT ESCs. (B) 2D FISH with probes for Hoxb1 (red) and Hoxd9 (green) in nuclei of WT and ΔH1 cells counterstained with DAPI (blue). Scale bar = 5 μm. Probe position and the distribution of normalized interprobe distances between WT and ΔH1 cells are as in Figure 2A. n = 2 biological replicates, each of 100 loci. (C) Box plot showing the distribution of nuclear sizes (plotted as radius in μm of a circle of equal area to that of the nucleus) for WT and ΔH1 cells. n = 100 cells.
Figure 5
Figure 5. H3K27me3 and Gene Expression at Hox Loci in Ring1B Mutant Cells
(A) ChIP for H3K27me3 at the promoters of Hoxb1, Hoxd1, Olig2, and β-actin, assayed by qRT-PCR, in WT (+/+) (black) or Ring1B−/− cells (gray). Enrichment is shown as mean percent input bound ± SEM over three biological replicates. (B) Mean log2 H3K27me3/input over Hoxb (left) and Hoxd (right), established by microarray hybridization of ChIPed material from Ring1B3−/− (top) or WT (+/+) (bottom) ESCs. Running mean of three biological and technical replicates (n = 5), with 1 kb window size and a 1 kb increment, is shown. Map position and RefSeq gene annotations are as in Figure 1B. (C) Log2 ratios ± SEM for Hox expression, assayed by qRT-PCR, in Ring1B mutant cells (+/−, white bars; −/−, gray bars) relative to WT. This is compared to the log2 changes in gene expression during the differentiation (diff/un) of OS25 ESCs (black bars). Asterisks indicate where levels of Hoxb2 and Hoxb4 induction during differentiation could not be analyzed by qRT-PCR because the transcripts in undifferentiated cells were only detectable after 40 cycles of PCR. (D) Log2 ratios ± SEM for Hox gene expression, from three biological replicates assayed by qRT-PCR, in Ring1B3−/− cells relative to WT (KO/WT, gray bars) (the same as in C) or in cells rescued with WT or I53A mutant relative to the Ring1B−/− cells (Rescue/KO, hatched and striped bars).
Figure 6
Figure 6. Chromatin Decompaction in the Absence of Ring1B
(A) 2D FISH with probe pairs at Hoxb and Hoxd and a control locus in nuclei of WT (+/+), Ring1B+/−, and Ring1B−/− cells, counterstained with DAPI (blue). Scale bar = 5 μm. Probe position and the distribution of normalized interprobe distances between WT and mutant cells are as in Figure 2A. n = 200 loci. (B) Box plots showing the distribution of normalized interprobe distances (d2/r2) measured by 3D FISH. Shaded boxes show the median and interquartile range of the data. Asterisks indicate outliers in the data set. n > 60 loci each.
Figure 7
Figure 7. Rescue of Chromatin Compaction, but Not Histone Ubiquitination, by Ring1B I53A
(A) Western blot of H2AK119ub levels in WT (Ring1B+/+) (Lane 1), Ring1B+/−(Lane 2), Ring1B−/− (Lane 3), dsRed-expressing cells with WT (Lane 4), or Ring1B I53A constructs (Lane 6) and EGFP cells expressing Ring1B WT (Lane 5) or Ring1B I53A (Lane 7). The graph displays H2Aub levels normalized to H3 and is set to 1 in Ring1B+/+ cells. (B) Western blot analysis of LaminB, Mel18, and Ring1B in nuclear extracts of WT (Ring1B+/+) (Lane 1), control dsRed cells (Lanes 2 and 4), and rescued cells expressing EGFP and either WT (Lane 3) or Ring1B I53A (Lane 5). (C) Nuclear extracts for WT (Ring1B+/+) (Lane 1), Ring1B−/− (Lane 2), control dsRed cells (Lanes 3 and 5), and rescued cells expressing EGFP and either WT (Lane 4) or Ring1B I53A (Lane 6) immunostained with EZH2, RYBP, and PCNA. (D) Immunoprecipitation with anti-IgG or anti-Ring1B from WT (Ring1B+/+) (Lanes 1–3), Ring1B−/−(Lanes 4–6), EGFP WT (Lanes 7–9), or Ring1B I53A (Lanes 10–12) nuclear extracts. 10% of total protein extracts were loaded as inputs. Immunostaining was performed using antibodies against EZH2, Mph2, Mel18, Ring1B, and RYBP. (E) Schematic representation of pTLC Ring1B expression vector (upper panel). Filled triangles = loxP sites. Lower panel: distribution from 2D FISH of normalized interprobe distances at Hoxb, Hoxd, and a control locus in nuclei of control Ring1B−/− ESCs expressing pTLC prior to Cre-mediated loxP excision (dsRed) versus the excised cells that express EGFP and WT Ring1B. 2× biological replicates, n > 95 nuclei. (F) As in (E), but for the I53A mutant Ring1B.

Comment in

References

    1. Allan J, Cowling GJ, Harborne N, Cattini P, Craigie R, Gould H. Regulation of the higher-order structure of chromatin by histones H1 and H5. J Cell Biol. 1981;90:279–288. - PMC - PubMed
    1. Azuara V, Perry P, Sauer S, Spivakov M, Jørgensen HF, John RM, Gouti M, Casanova M, Warnes G, Merkenschlager M, Fisher AG. Chromatin signatures of pluripotent cell lines. Nat Cell Biol. 2006;8:532–538. - PubMed
    1. Bates DL, Butler PJ, Pearson EC, Thomas JO. Stability of the higher-order structure of chicken-erythrocyte chromatin in solution. Eur J Biochem. 1981;119:469–476. - PubMed
    1. Bel-Vialar S, Itasaki N, Krumlauf R. Initiating Hox gene expression: in the early chick neural tube differential sensitivity to FGF and RA signaling subdivides the HoxB genes in two distinct groups. Development. 2002;129:5103–5115. - PubMed
    1. Bernstein BE, Mikkelsen TS, Xie X, Kamal M, Huebert DJ, Cuff J, Fry B, Meissner A, Wernig M, Plath K, et al. A bivalent chromatin structure marks key developmental genes in embryonic stem cells. Cell. 2006;125:315–326. - PubMed

Publication types

MeSH terms

Associated data