. 2010 Jul 1;9(7):824-34.
doi: 10.1016/j.dnarep.2010.04.007. Epub 2010 May 15.

The Saccharomyces cerevisiae RAD9, RAD17 and RAD24 genes are required for suppression of mutagenic post-replicative repair during chronic DNA damage

Affiliations

The Saccharomyces cerevisiae RAD9, RAD17 and RAD24 genes are required for suppression of mutagenic post-replicative repair during chronic DNA damage

Akiko Murakami-Sekimata et al. DNA Repair (Amst). .

Abstract

In Saccharomyces cerevisiae, a DNA damage checkpoint in the S-phase is responsible for delaying DNA replication in response to genotoxic stress. This pathway is partially regulated by the checkpoint proteins Rad9, Rad17 and Rad24. Here, we describe a novel hypermutable phenotype for rad9Delta, rad17Delta and rad24Delta cells in response to a chronic 0.01% dose of the DNA alkylating agent MMS. We report that this hypermutability results from DNA damage introduction during the S-phase and is dependent on a functional translesion synthesis pathway. In addition, we performed a genetic screen for interactions with rad9Delta that confer sensitivity to 0.01% MMS. We report and quantify 25 genetic interactions with rad9Delta, many of which involve the post-replication repair machinery. From these data, we conclude that defects in S-phase checkpoint regulation lead to increased reliance on mutagenic translesion synthesis, and we describe a novel role for members of the S-phase DNA damage checkpoint in suppressing mutagenic post-replicative repair in response to sublethal MMS treatment.


Conflict of interest statement

Conflict of interest

The authors declare that there are no conflicts of interest.

Figures

Figure 1
Figure 1
Pie chart summarizing the results of the rad9Δ synthetic genetic screen in the presence of 0.01% methylmethane sulfonate (MMS). Genes were categorized according to their annotations in the Saccharomyces Genome Database (www.yeastgenome.org). The genes showing interactions with RAD9 include genes functioning to accommodate DNA damage during replication and others that are previously unknown to be involved in the DNA damage response. Genes listed with asterisks represent interactions not previously identified. Fifteen novel RAD9 genetic interactions were uncovered in this screen. Abbreviations are as follows: PRR, post-replication repair; HR, homologous recombination.
Figure 2
Figure 2
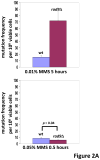
MMS dose-dependent hypermutation phenotype in the rad9Δ mutant. A) Log-phase wild type (BY4741) and rad9Δ (CB1021) cells (BY4741 background) were grown in the presence of 0.01% MMS for 5 hours and then harvested for determination of survival (62±5% and 4.8±0.5% for wild type and rad9Δ cells, respectively) and induction of mutation to CanR (upper panel). In parallel, the survival and mutation rates were also determined for wild type and rad9Δ cells grown for a shorter time (0.5 hour) in higher-concentration (0.05%) of MMS (lower panel, the survival rate for wild type and rad9Δ were 98±3% and 73±4%, respectively). Each strain was tested in triplicate, and the error bars represent the standard deviations. B) Yeast cells from a different genetic background (A364a) were tested for mutation to CanR as well as induction of SCE after MMS exposure (as above). The survival rate for wild type (yMP10381) and rad9Δ (yMP11030) were 79±6% and 3.1±0.2%, respectively in the 0.01%/5 hour MMS treatment; the survival rate for wild type and rad9Δ were 88±6% and 84±2%, respectively in the 0.05%/0.5 hour MMS treatment. Each strain was tested in triplicate, and the error bars represent standard deviations. C) The MMS-induced hypermutability of rad9Δ is REV3-dependent. Wild type (yMP10381), rad9Δ (yMP11030), rev3Δ (yMP10382), and rad9Δ rev3Δ (yDH51, yDH52, yDH53) cells were tested for survival and mutation to CanR after treatment with a very low concentration of MMS (0.001%) for 5 hours (low concentration MMS was required due to the high sensitivity of the rad9Δ rev3Δ double mutant, Table 2). The survival rate for wild type, rad9Δ, rev3Δ and rad9Δ rev3Δ cells were 93±3%, 63±4%, 90±12% and 12±1%, respectively. Each strain was tested in triplicate, and the error bars represent standard deviations.
Figure 2
Figure 2
MMS dose-dependent hypermutation phenotype in the rad9Δ mutant. A) Log-phase wild type (BY4741) and rad9Δ (CB1021) cells (BY4741 background) were grown in the presence of 0.01% MMS for 5 hours and then harvested for determination of survival (62±5% and 4.8±0.5% for wild type and rad9Δ cells, respectively) and induction of mutation to CanR (upper panel). In parallel, the survival and mutation rates were also determined for wild type and rad9Δ cells grown for a shorter time (0.5 hour) in higher-concentration (0.05%) of MMS (lower panel, the survival rate for wild type and rad9Δ were 98±3% and 73±4%, respectively). Each strain was tested in triplicate, and the error bars represent the standard deviations. B) Yeast cells from a different genetic background (A364a) were tested for mutation to CanR as well as induction of SCE after MMS exposure (as above). The survival rate for wild type (yMP10381) and rad9Δ (yMP11030) were 79±6% and 3.1±0.2%, respectively in the 0.01%/5 hour MMS treatment; the survival rate for wild type and rad9Δ were 88±6% and 84±2%, respectively in the 0.05%/0.5 hour MMS treatment. Each strain was tested in triplicate, and the error bars represent standard deviations. C) The MMS-induced hypermutability of rad9Δ is REV3-dependent. Wild type (yMP10381), rad9Δ (yMP11030), rev3Δ (yMP10382), and rad9Δ rev3Δ (yDH51, yDH52, yDH53) cells were tested for survival and mutation to CanR after treatment with a very low concentration of MMS (0.001%) for 5 hours (low concentration MMS was required due to the high sensitivity of the rad9Δ rev3Δ double mutant, Table 2). The survival rate for wild type, rad9Δ, rev3Δ and rad9Δ rev3Δ cells were 93±3%, 63±4%, 90±12% and 12±1%, respectively. Each strain was tested in triplicate, and the error bars represent standard deviations.
Figure 3
Figure 3
Relationship between the hypermutability phenotype and cell cycle distribution. A) Cell cycle redistribution following continuous exposure of asynchronous populations of wild type (yMP10381) or rad9Δ (yMP11030) cells to 0.01% and 0.05% MMS. At indicated times of exposure, samples were removed and analyzed by flow cytometry. Each panel contains two histograms. Shaded histograms represent the cell cycle distribution of the asynchronous culture, before addition of MMS. Overlaid histograms represent the cell cycle distribution at various times after addition of MMS. B) Percentage of unbudded cells at the indicated time during MMS exposure in liquid cultures for wild type and rad9Δ cells. C) Multiple intra-S phase checkpoint defective strains show hypermutability in 0.01% MMS. Wild type (yMP10381), rad9Δ (yMP11030), rad17Δ (yMP11089), and rad24Δ (yMP11006) cells were tested for survival, mutation to CanR and SCE after exposure to 0.01% MMS for 5 hours, as above. The survival rate for wild type, rad9Δ, rad17Δ, and rad24Δ cells were 66±8%, 3.5±0.3%, 4.1±0.2% and 1.7±0.2% respectively. Each strain was tested in triplicate, and the error bars represent standard deviations.
Figure 3
Figure 3
Relationship between the hypermutability phenotype and cell cycle distribution. A) Cell cycle redistribution following continuous exposure of asynchronous populations of wild type (yMP10381) or rad9Δ (yMP11030) cells to 0.01% and 0.05% MMS. At indicated times of exposure, samples were removed and analyzed by flow cytometry. Each panel contains two histograms. Shaded histograms represent the cell cycle distribution of the asynchronous culture, before addition of MMS. Overlaid histograms represent the cell cycle distribution at various times after addition of MMS. B) Percentage of unbudded cells at the indicated time during MMS exposure in liquid cultures for wild type and rad9Δ cells. C) Multiple intra-S phase checkpoint defective strains show hypermutability in 0.01% MMS. Wild type (yMP10381), rad9Δ (yMP11030), rad17Δ (yMP11089), and rad24Δ (yMP11006) cells were tested for survival, mutation to CanR and SCE after exposure to 0.01% MMS for 5 hours, as above. The survival rate for wild type, rad9Δ, rad17Δ, and rad24Δ cells were 66±8%, 3.5±0.3%, 4.1±0.2% and 1.7±0.2% respectively. Each strain was tested in triplicate, and the error bars represent standard deviations.
Figure 4
Figure 4
One model proposing a role for RAD9 in regulating how lesions are channeled at the replication fork. Under the model, in the presence of MMS, RAD9 activity would strongly and actively promote use of non-mutagenic base excision repair (and/or alkylation reversal), while it would actively suppress mutagenic translesion synthesis. Hence, loss of RAD9 function would reduce the efficacy of base excision repair, thereby increasing the reliance of cells on template switching and translesion synthesis for survival; this would explain the synergy observed between the rad9Δ and both the mms2 and rev3 mutants. Additionally, loss of RAD9 function would result in derepression of translesion synthesis, resulting in the hypermutable phenotype observed in our experiments. Hence, under this model, RAD9 stabilizes the genome by maximizing the cell’s ability to employ non-mutagenic mechanisms (base excision repair and template switching) of repairing or tolerating lesions, while suppressing mutagenic translesion synthesis. As discussed in the text, a second alternative model is that RAD9 acts to promote continuous DNA synthesis, potentially by limiting re-priming of stalled forks at MMS lesions. In this model, the observed hypermutability in MMS-treated rad9Δ cells may be due to an increased reliance on PRR to repair large ssDNA gaps resulting from discontinuous synthesis, which would explain the synergy between rad9Δ and both the MMS2 and REV3 branches of PRR.

Similar articles

Cited by

References

    1. Weinert TA, Hartwell LH. The RAD9 gene controls the cell cycle response to DNA damage in saccharomyces cerevisiae. Science. 1988;241:317–322. - PubMed
    1. Siede W, Friedberg AS, Friedberg EC. RAD9-dependent G1 arrest defines a second checkpoint for damaged DNA in the cell cycle of saccharomyces cerevisiae. Proc Natl Acad Sci U S A. 1993;90:7985–7989. - PMC - PubMed
    1. Paulovich AG, Hartwell LH. A checkpoint regulates the rate of progression through S phase in S. cerevisiae in response to DNA damage. Cell. 1995;82:841–847. - PubMed
    1. Walsh T, King MC. Ten genes for inherited breast cancer. Cancer Cell. 2007;11:103–105. - PubMed
    1. Friedberg EC, Friedberg EC. DNA Repair and Mutagenesis. ASM Press; Washington, D.C: 2006.

Publication types

MeSH terms