. 2010 Jul 16;285(29):22666-75.
doi: 10.1074/jbc.M109.100131. Epub 2010 May 14.

Specific behavior of intracellular Streptococcus pyogenes that has undergone autophagic degradation is associated with bacterial streptolysin O and host small G proteins Rab5 and Rab7

Affiliations

Specific behavior of intracellular Streptococcus pyogenes that has undergone autophagic degradation is associated with bacterial streptolysin O and host small G proteins Rab5 and Rab7

Atsuo Sakurai et al. J Biol Chem. .

Abstract

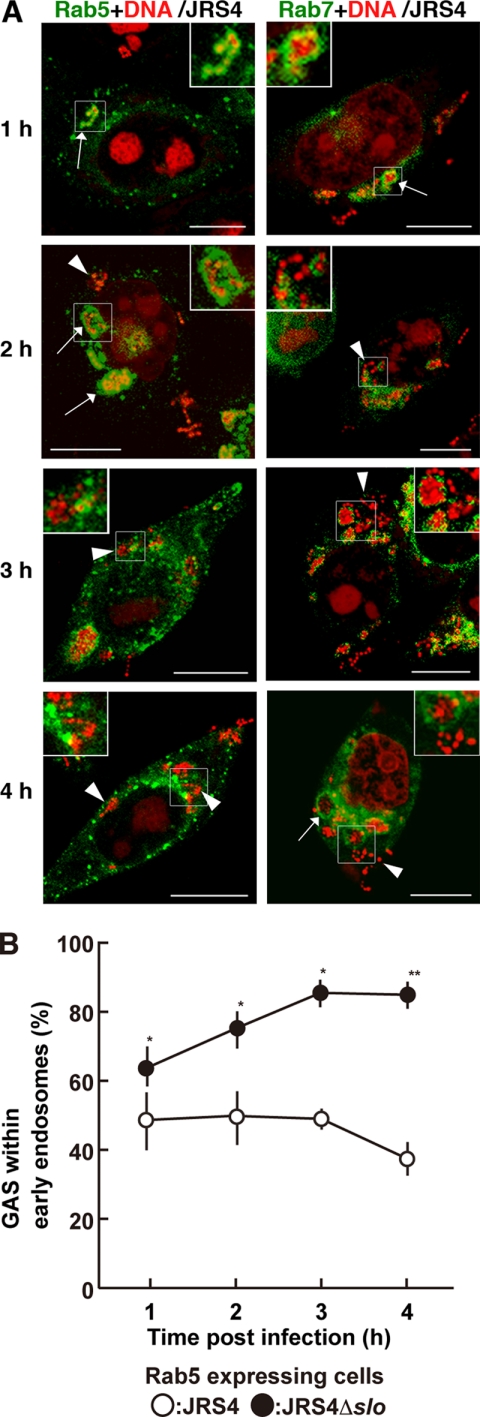
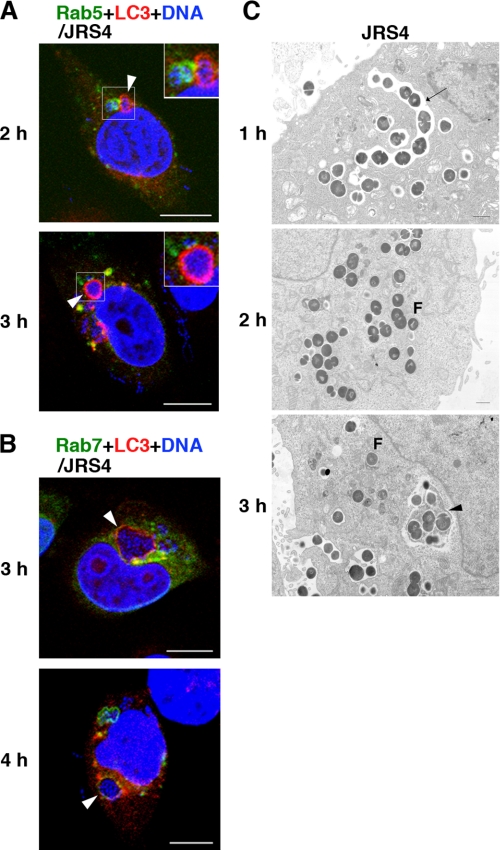
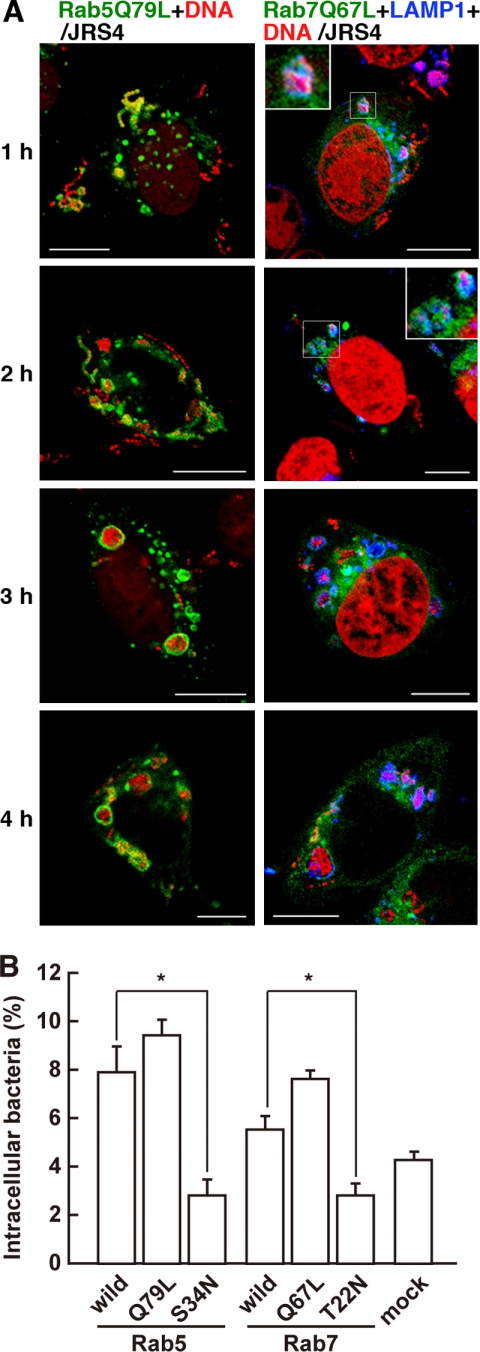
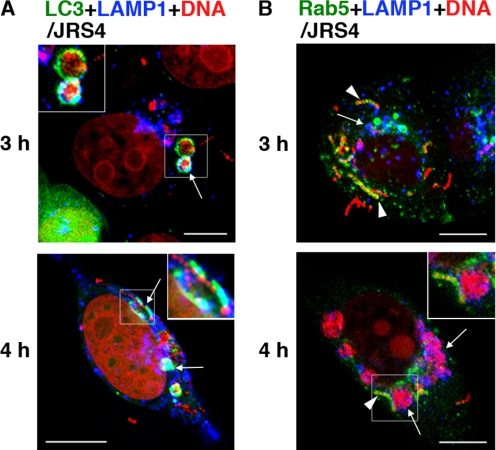
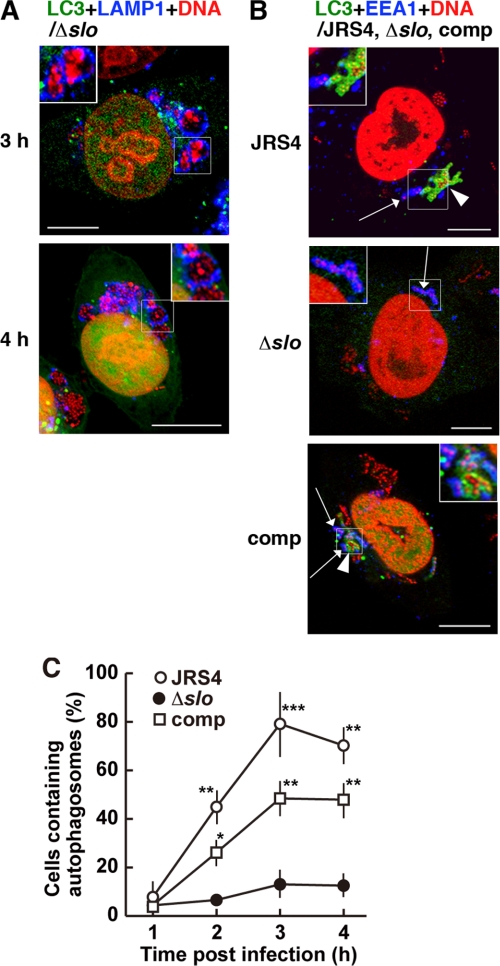
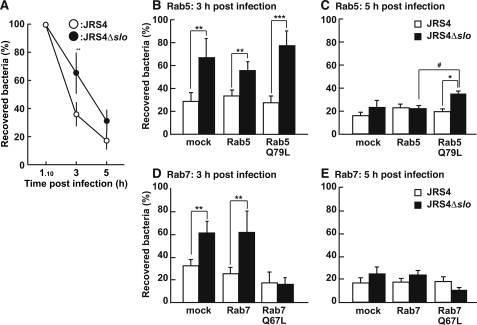
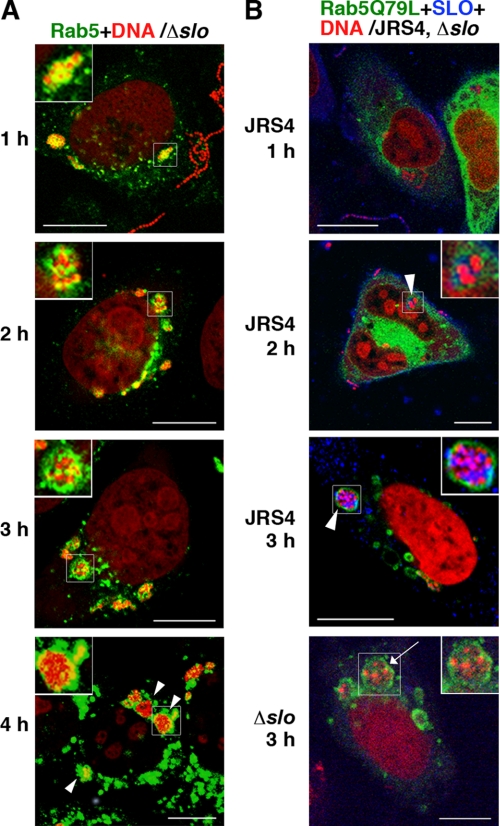
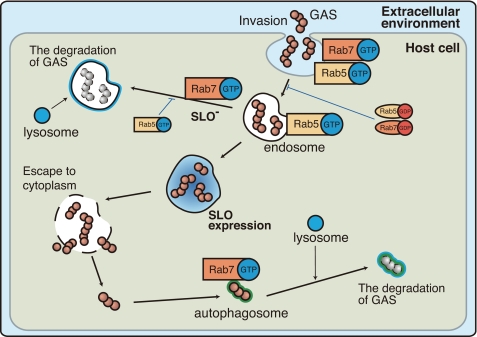
Streptococcus pyogenes (group A streptococcus (GAS)) is a pathogen that invades non-phagocytic host cells, and causes a variety of acute infections such as pharyngitis. Our group previously reported that intracellular GAS is effectively degraded by the host-cell autophagic machinery, and that a cholesterol-dependent cytolysin, streptolysin O (SLO), is associated with bacterial escape from endosomes in epithelial cells. However, the details of both the intracellular behavior of GAS and the process leading to its autophagic degradation remain unknown. In this study, we found that two host small G proteins, Rab5 and Rab7, were associated with the pathway of autophagosome formation and the fate of intracellular GAS. Rab5 was involved in bacterial invasion and endosome fusion. Rab7 was clearly multifunctional, with roles in bacterial invasion, endosome maturation, and autophagosome formation. In addition, this study showed that the bacterial cytolysin SLO supported the escape of GAS into the cytoplasm from endosomes, and surprisingly, a SLO-deficient mutant of GAS was viable longer than the wild-type strain although it failed to escape the endosomes. This intracellular behavior of GAS is unique and distinct from that of other types of bacterial invaders. Our results provide a new picture of GAS infection and host-cell responses in epithelial cells.


Figures

FIGURE 1.
FIGURE 1.
Localization of intracellular GAS and Rab proteins in HeLa cells. A, HeLa cells expressing fluorescently labeled Rab5 (left panels) or Rab7 (right panels) were infected with GAS strain JRS4. The times shown indicate the elapsed time after infection. Rab proteins with EGFP are shown in green. Bacterial and host DNA was stained red with PI. Arrows indicate early endosomes (Rab5) or Rab7-positive compartments (Rab7) that contained bacteria. Arrowheads show bacteria in the cytoplasm. Insets show magnified images of bacteria trapped by endosomes or free in the cytoplasm. Bars, 10 μm. The same images divided by color are shown in supplemental Fig. S1. B, cells expressing Rab5 were infected with JRS4 (open circles) or JRS4Δslo (closed circles) for the indicated period. The ratio of trapped GAS in endosomes to total intracellular bacteria was determined from confocal microscopic images. The p value was determined by comparing cells infected with JRS4Δslo to those infected with JRS4 using Student's t test (*, p < 0.05, and **, p < 0.01).
FIGURE 2.
FIGURE 2.
Localization of endosomal structures and LC3-positive compartments (indicating autophagosomes) in GAS-infected cells. A and B, cells expressing fluorescently labeled Rab5 (A), Rab7 (B), and LC3 (A and B) were infected with GAS strain JRS4. Early endosomes (A) and Rab7-positive endosomal structures (B) were labeled with EGFP (green). Autophagosomes were labeled with mCherry (red). Bacterial and host DNA was stained blue with 4′,6-diamino-2-phenylindole. Arrowheads indicate bacteria surrounded by autophagosomes that were not within early endosomes (A) or that were also trapped in Rab7-positive compartments (B). Bars, 10 μm. The same images divided by color are shown in supplemental Fig. S2, A and B. C, JRS4-infected cells were observed by electron microscopy. Arrows and arrowheads indicate endosomes and autophagosomes, respectively. F shows bacteria in the cytoplasm. Bars, 1 μm.
FIGURE 3.
FIGURE 3.
Influence of DA and DN mutants of Rab on the formation and maturation of early endosomes and bacterial invasion into GAS-infected cells. A, cells expressing Rab5Q79L (DA form of Rab5) (left panels) or Rab7Q67L (DA form of Rab7) (right panels) were infected with GAS strain JRS4. Endosomal structures were labeled with EGFP (green). Bacterial and host DNA was stained with PI (red). Lysosomes are indicated by LAMP1 stained with a specific antibody and Cy5-conjugated secondary antibody (blue, data are shown in right panels). The same images divided by color are shown in supplemental Fig. S3. Bars, 10 μm. B, cells expressing Rab5, Rab5Q79L, Rab5S34N (DN form of Rab5), Rab7, Rab7Q67L, or Rab7T22N (DN form of Rab7) were infected with JRS4 for 1 h and incubated with antibiotics for an additional 10 min. The number of intracellular live JRS4 was counted, and the ratio of intracellular JRS4 to the number of bacteria added to the cell cultures is shown. Mock cells were transfected with empty vector prior to their infection with JRS4. p values were determined by comparison with the cells expressing wild-type Rab proteins (*, p < 0.05) using Student's t test.
FIGURE 4.
FIGURE 4.
Localization of early endosomes, autophagosomes, and lysosomes in GAS-infected cells. A and B, cells expressing fluorescently labeled LC3 to indicate autophagosomes (A) or Rab5 to indicate early endosomes (B) were infected with JRS4 for 3 or 4 h. Autophagosomes or early endosomes were labeled with EGFP (green). Bacterial and host DNA were stained with PI (red). Cells were stained with anti-LAMP-1 to indicate lysosomes (A and B) (blue). The same images divided by color are shown in supplemental Fig. S5, A and B. A, arrows and insets indicate autophagosomes sequestering bacteria and fused with lysosomes. B, arrows indicate LAMP-1, which contained intracellular bacteria but not co-localized within early endosomes. Arrowheads indicate early endosomes surrounding bacteria but not co-localized with LAMP-1. Insets show bacteria surrounded by LAMP-1, adjacent to early endosomes. Bars, 10 μm.
FIGURE 5.
FIGURE 5.
Influence of SLO on the induction of autophagy in GAS-infected cells. A and B, cells expressing LC3 were infected with one of the GAS strains, JRS4, JRS4Δsloslo), or JRS4Δslo-comp (comp). Bacterial and host DNA was stained with PI (red). Autophagosomes were visualized with EGFP (green). The same images divided by color are shown in supplemental Fig. S7, A and B. Bars, 10 μm. A, cells infected with JRS4Δslo were stained with an anti-LAMP-1 antibody to indicate lysosomes (blue). The insets show that bacteria were surrounded by lysosomes but not by autophagosomes. B, cells were infected with GAS for 2 h. Early endosomal antigen-1 was stained with a specific antibody to indicate early endosomes (blue). Arrows indicate early endosomes surrounding bacteria. Arrowheads indicate bacteria sequestered by autophagosomes. Insets show autophagosomes containing bacteria adjacent to endosomes (JRS4, comp) or bacteria only within endosomes (Δslo). C, cells expressing fluorescently labeled LC3 to indicate autophagosomes were infected with JRS4 (open circles), JRS4Δsloslo; closed circles), or JRS4Δslo-comp (comp; open squares). Data are shown as the percentage of GAS-infected cells forming autophagosomes. p values were determined by comparison with the percentage of cells infected with JRS4Δslo using the χ-square test (*, p < 0.05; **, p < 0.01; and ***, p < 0.005).
FIGURE 6.
FIGURE 6.
Influence of SLO expression on bacterial viability in infected cells. A–E, cells were infected with JRS4 (open circles and bars) or JRS4Δslo (closed circles and bars) for 1 h and 10 min, 3 h (A, B, and D), or 5 h (A, C, and E). Data are shown as the percentage of GAS at 3 or 5 h after infection in comparison with that 10 min after the replacement of medium (1 h and 10 min after infection). B–E, cells were transfected with plasmids expressing wild-type Rab5 (B and C), Rab5Q79L (B and C), wild-type Rab7 (D and E), or Rab7Q67L (D and E) prior to infection. Mock cells were transfected with empty vector. p values were determined by comparison with the percentage of live JRS4 using Student's t test (*, p < 0.05; **, p < 0.01; and ***, p < 0.005) or live JRS4Δslo in cells expressing wild-type Rab5 using Scheffe's test (#, p < 0.05).
FIGURE 7.
FIGURE 7.
The lack of SLO accumulation in endosomes influences the behavior of intracellular GAS. A and B, cells expressing Rab5 (A) or Rab5Q79L (B) were infected with JRS4 (B) or JRS4Δsloslo) (A and B). Early endosomal structures were visualized with EGFP (green). Bacterial and cellular DNA was stained with PI (red). The same images divided by color are shown in supplemental Fig. S8, A and B. Bars, 10 μm. A, arrowheads and insets indicate bacteria located in early endosomes. B, SLO was stained with a specific antibody (blue). Arrowheads and insets (JRS4) indicate the localization of SLO within endosomes. Arrow and inset in the image of JRS4Δslo-infected cells indicate endosomes without accumulated SLO.
FIGURE 8.
FIGURE 8.
Schematic diagram of the endosomal and autophagic degradation pathway of intracellular GAS in HeLa cells. The illustration shows the intracellular behavior of GAS, including their invasion and escape into the cytoplasm (with SLO expression), in relation to the endosomal and autophagic degradation of GAS by the host cell. The involvement of both GDP- and GTP-bound forms of Rab5 and Rab7 in each event is also indicated. The endosomal and autophagic pathways of GAS are dependent on SLO expression and shown as thick lines. Blue arrows indicate the inhibition of these pathways by active or inactive Rab proteins.

References

    1. Bisno A. L., Brito M. O., Collins C. M. (2003) Lancet Infect. Dis. 3, 191–200 - PubMed
    1. Lukomski S., Sreevatsan S., Amberg C., Reichardt W., Woischnik M., Podbielski A., Musser J. M. (1997) J. Clin. Invest. 99, 2574–2580 - PMC - PubMed
    1. Madden J. C., Ruiz N., Caparon M. (2001) Cell 104, 143–152 - PubMed
    1. Buchanan J. T., Simpson A. J., Aziz R. K., Liu G. Y., Kristian S. A., Kotb M., Feramisco J., Nizet V. (2006) Curr. Biol. 16, 396–400 - PubMed
    1. Carapetis J. R., Steer A. C., Mulholland E. K., Weber M. (2005) Lancet Infect. Dis. 5, 685–694 - PubMed

Publication types

MeSH terms

LinkOut - more resources