. 2010 Jul;76(14):4655-63.
doi: 10.1128/AEM.00358-10. Epub 2010 May 14.

Adaptation in a mouse colony monoassociated with Escherichia coli K-12 for more than 1,000 days

Affiliations

Adaptation in a mouse colony monoassociated with Escherichia coli K-12 for more than 1,000 days

Sean M Lee et al. Appl Environ Microbiol. 2010 Jul.

Abstract

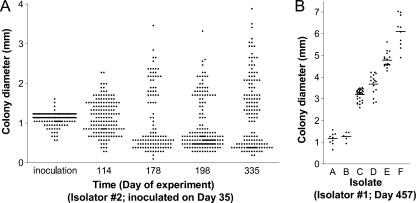
Although mice associated with a single bacterial species have been used to provide a simple model for analysis of host-bacteria relationships, bacteria have been shown to display adaptability when grown in a variety of novel environments. In this study, changes associated with the host-bacterium relationship in mice monoassociated with Escherichia coli K-12 over a period of 1,031 days were evaluated. After 80 days, phenotypic diversification of E. coli was observed, with the colonizing bacteria having a broader distribution of growth rates in the laboratory than the parent E. coli. After 1,031 days, which included three generations of mice and an estimated 20,000 generations of E. coli, the initially homogeneous bacteria colonizing the mice had evolved to have widely different growth rates on agar, a potential decrease in tendency for spontaneous lysis in vivo, and an increased tendency for spontaneous lysis in vitro. Importantly, mice at the end of the experiment were colonized at an average density of bacteria that was more than 3-fold greater than mice colonized on day 80. Evaluation of selected isolates on day 1,031 revealed unique restriction endonuclease patterns and differences between isolates in expression of more than 10% of the proteins identified by two-dimensional electrophoresis, suggesting complex changes underlying the evolution of diversity during the experiment. These results suggest that monoassociated mice might be used as a tool for characterizing niches occupied by the intestinal flora and potentially as a method of targeting the evolution of bacteria for applications in biotechnology.


Figures

FIG. 1.
FIG. 1.
Variation in colony size on agar plates after approximately 17 h of growth at 37°C as described in Materials and Methods. The colony sizes on agar plates correlated with growth rates in liquid glucose-based medium and were taken as a convenient measure of the relative growth rate in vitro. (A) Colony sizes of E. coli K-12 cells used to inoculate mice in isolator 2 were compared with the relative colony sizes of bacteria isolated from the cecum of mice in isolator 2 at various times postinoculation. Samples from three mice at each time point were evaluated, and all data for a given time point are plotted together. (B) Bacteria from mice in isolator 1 at day 457 of the experiment were grown on agar plates, followed by selection of individual colonies of various sizes (isolates A through F), which were in turn replated on agar. Each isolate maintained the growth rate that was initially observed. The bar indicates the average relative colony size of each isolate following replating. In this particular experiment, the size of bacterial colonies formed by the strain used to inoculate isolator 1 (day zero) was 3.65 mm ± 0.04 mm (mean ± standard error).
FIG. 2.
FIG. 2.
Assessment of bacterial cell lysis by flow cytometry. (A to C) Light scattering determined with size calibration beads is shown (A). In addition, the fluorescence versus forward light scattering is shown for cultured bacteria used to inoculate mice in isolator 1 either before (B) or after (C) lysis using a commercially available lytic solution. (D to F) Histogram showing forward light scattering of the cultured bacteria before (solid line) and after (dotted line) lysis with lytic solution (D), a series of five freeze-thaw cycles (E), or aging for over a month in the laboratory without nutrition (F). Protocols for culture and lysis of the bacteria are described in Materials and Methods, and similar results were obtained for cultured bacteria used to inoculate mice in isolator 2 (data not shown).
FIG. 3.
FIG. 3.
Bacterial colonization in the ceca of mice early and at the end of the experiment on day 1,031. Forward light scattering as a measure of relative bacterial cell size was assessed in bacteria isolated from the ceca of mice early (n = 10 on day 80 in isolator 1 and n = 8 on day 114 in isolator 2) and at the end (n = 8) of the experiment. The results from SPF mice, fully colonized with a normal bacterial flora (n = 4) are shown for comparison. Bacteria were distinguished from other particulate matter in the cecal contents by staining with SYTO BC green nucleic acid stain, which was detected using the FITC channel. (A) Flow cytometry profiles of a blank sample containing no cecal contents, with regions corresponding to intact bacterial cells, cell debris (cd), and fiber labeled. The region just under the area marked cell debris is possibly a combination of cell debris and fiber and thus was not evaluated in the study. (B to D) Flow cytometry profiles of a representative sample of cecal contents from a mouse on day 80 in isolator 1 (B), a representative sample of cecal contents from a mouse on day 1,031 of the experiment (C), and a representative sample of cecal contents from an SPF mouse (D). (E to G) Each point in the scatter plots represents the result obtained using the cecal contents of one mouse, with the exception of two data points from isolator 2, each of which represents results obtained using the combined cecal contents from two mice. The lines indicate the means of the data at each time point. The bacteria/gram dry cecal weight (E), ratio of intact bacterial cells to cell debris (F), and microparticulate fiber/gram dry cecal weight (G) are shown. When comparing results from samples taken at day 80 or day 114 with those at day 1,031, the differences in bacteria concentration (E) and cell integrity (F) were highly significant (P < 0.0001) in all cases. The difference in average microparticulate fiber at day 80 was significantly (P = 0.0015) different that that observed at day 1,031, although the difference at day 114 and day 1,031 was not significant (P = 0.0752). A two-way unpaired t test was used to calculate P values.
FIG. 4.
FIG. 4.
Lysis of cultured bacterial cells over time. The lysis of bacteria used to inoculate mice in isolator 1 (Iso 1) and isolator 2 (Iso 2), bacteria obtained from the cecum of mice at day 1,031 of the experiment, and bacteria obtained from SPF mice was assessed by flow cytometry. Cultured, frozen bacteria or cecal contents, where appropriate, were used to inoculate medium and allowed to grow for 17 h at 37°C, at which time 50 μl of liquid culture was used to inoculate an additional 10 ml of liquid medium, as described in Materials and Methods. The lysis of bacteria was then assessed by flow cytometry 24 h and 72 h after the second inoculation. (A and B) Representative histograms created from the forward scatter profile of bacteria used to inoculate mice in isolator 1 (A) and bacteria from the cecum of a mouse at day 1,031 (B). (C) Each point represents the result obtained using either one of the strains used to inoculate the isolators or the cecal contents of one mouse. The lines indicate the means of the data at each time point.
FIG. 5.
FIG. 5.
Comparison of the phenotypes and genotypes of a fast-growing isolate and a slow-growing isolate obtained on day 1,031 of the experiment. These two isolates were confirmed to have identical 16S sequences to the parent strain that was used to inoculate isolator 2. (A) 2D-DIGE analysis shows the proteomes of two isolates obtained from the mice at day 1,031. Proteins produced predominantly by the slow-growing isolate are indicated by red fluorescence, proteins produced by the fast-growing isolate are indicated by green fluorescence, and proteins produced in similar amounts by both isolates are indicated by yellow fluorescence. Isolates were grown to 26% to 41% of maximum density in glucose-rich medium (Dulbecco's modified Eagle's medium) before extraction of the protein and analysis, and the experiment was conducted in triplicate. (B) Assessment of restriction fragment length polymorphisms shows unique cleavage patterns (21) of XbaI for both isolates from day 1,031, which are distinct from the patterns observed in the clones used to inoculate the isolators. Bands or the absence of bands in the isolates that are distinct from each other and from the pattern observed in the clones used to inoculate the isolators are indicated by a red dot. The brightness and contrast of each lane were adjusted independently for clarity of illustration, although the raw data, without manual adjustment, were analyzed using BioNumerics to identify the unique bands indicated by the red dots.

References

    1. Barbas, A. S., A. P. Lesher, A. D. Thomas, A. Wyse, A. P. Devalapalli, Y.-H. Lee, H.-E. Tan, P. E. Orndorff, R. B. Bollinger, and W. Parker. 2009. Altering and assessing persistence of genetically modified E. coli MG1655 in the large bowel. Exp. Biol. Med. 234:1174-1185. - PubMed
    1. Blattner, F. R., G. Plunkett III, C. A. Bloch, N. T. Perna, V. Burland, M. Riley, J. Collado-Vides, J. D. Glasner, C. K. Rode, G. F. Mayhew, J. Gregor, N. W. Davis, H. A. Kirkpatrick, M. A. Goeden, D. J. Rose, B. Mau, and Y. Shao. 1997. The complete genome sequence of Escherichia coli K-12. Science 277:1453-1474. - PubMed
    1. Bloch, C. A., B. A. Stocker, and P. E. Orndorff. 1992. A key role for type 1 pili in enterobacterial communicability. Mol. Microbiol. 6:697-701. - PubMed
    1. Brennan-Craddock, W. E., A. K. Mallett, I. R. Rowland, and S. Neale. 1992. Developmental changes to gut microflora metabolism in mice. J. Appl. Bacteriol. 73:163-167. - PubMed
    1. Buckling, A., R. Craig Maclean, M. A. Brockhurst, and N. Colegrave. 2009. The Beagle in a bottle. Nature 457:824-829. - PubMed

Publication types