. 2010 Jul;192(14):3678-88.
doi: 10.1128/JB.00255-10. Epub 2010 May 14.

The genetic basis of laboratory adaptation in Caulobacter crescentus

Affiliations

The genetic basis of laboratory adaptation in Caulobacter crescentus

Melissa E Marks et al. J Bacteriol. 2010 Jul.

Abstract

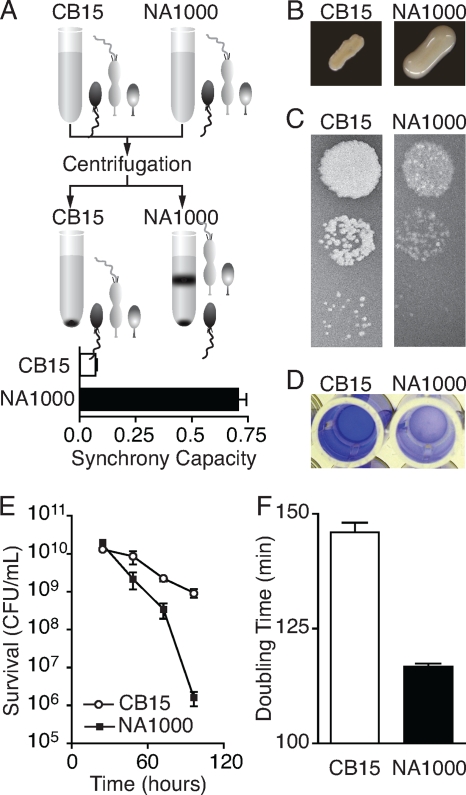
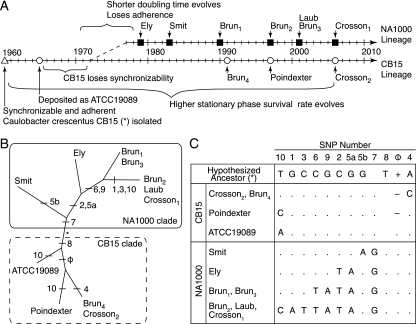
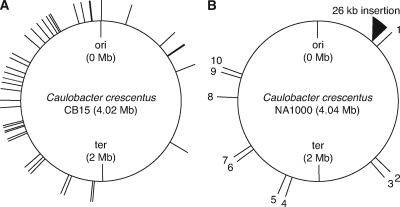
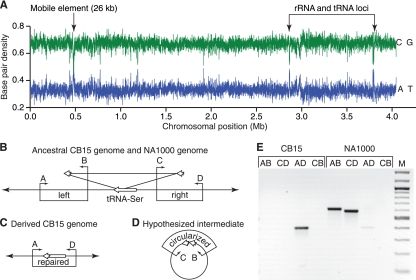
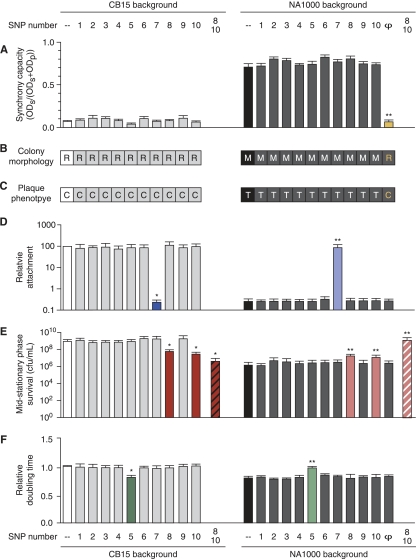
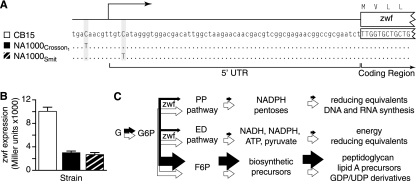
The dimorphic bacterium Caulobacter crescentus has evolved marked phenotypic changes during its 50-year history of culture in the laboratory environment, providing an excellent system for the study of natural selection and phenotypic microevolution in prokaryotes. Combining whole-genome sequencing with classical molecular genetic tools, we have comprehensively mapped a set of polymorphisms underlying multiple derived phenotypes, several of which arose independently in separate strain lineages. The genetic basis of phenotypic differences in growth rate, mucoidy, adhesion, sedimentation, phage susceptibility, and stationary-phase survival between C. crescentus strain CB15 and its derivative NA1000 is determined by coding, regulatory, and insertion/deletion polymorphisms at five chromosomal loci. This study evidences multiple genetic mechanisms of bacterial evolution as driven by selection for growth and survival in a new selective environment and identifies a common polymorphic locus, zwf, between lab-adapted C. crescentus and clinical isolates of Pseudomonas aeruginosa that have adapted to a human host during chronic infection.


Figures

FIG. 1.
FIG. 1.
Evolved phenotypic differences between CB15 (Crosson2) and NA1000 (Crosson1). (A) Caulobacter cells divide asymmetrically to yield a swarmer and a stalked cell, which are mixed in culture. NA1000 stalked and predivisional cells (light gray) pellet less efficiently than swarmer cells (dark gray), allowing them to be physically separated. Synchrony capacity is quantified by calculating the proportion of cultured cells remaining in suspension. Error bars are ±standard errors of the mean (SEM). (B) When patched and grown on high-sugar media, NA1000 colonies develop a mucoid morphology, while CB15 colonies do not. (C) The transducing phage φCR30 efficiently infects and lyses CB15 cells, resulting in clear plaques, while infection of NA1000 with the same phage lysate results in fewer plaques that are visually turbid. (D) Holdfast-mediated attachment to a surface can be measured using a crystal violet assay. CB15 cells attach, resulting in robust staining, while NA1000 exhibits negligible adherence. (E) Upon continued aeration and incubation of stationary-phase Caulobacter cultures, NA1000 (▪) loses viability more rapidly than CB15 (○). Error bars are ±SEM. (F) In glucose minimal medium, NA1000 generation time is 20% shorter than that of CB15. Error bars are ±SEM.
FIG. 2.
FIG. 2.
History of laboratory-cultivated Caulobacter crescentus strains CB15 and NA1000. (A) The synchronizable CB15/NA1000 ancestor was originally isolated in 1960 (▵) and deposited with the ATCC (○). Following spontaneous loss of synchronizability, a new synchronizable derivative was isolated (NA1000). The source and freeze date for each CB15 (○) and NA1000 (▪) isolate, as well as the approximate timing of phenotypic evolution in both lineages, are indicated. The Brun, Laub, and Crosson strains are all endpoints originally derived from stock strains in the laboratory of Lucy Shapiro (Stanford University). (B) A DNA parsimony tree based on the 11 polymorphic sites forms two clades representing the NA1000 and CB15 lineages, and strain positions within the tree are consistent with their freeze dates (Table 1). The branches where SNPs evolved are indicated. Branch lengths are not drawn to scale. (C) Genotype data for the archived strains and the inferred CB15/NA1000 ancestral genotype. SNPs are numbered according to genomic position (Fig. 3).
FIG. 3.
FIG. 3.
Schematic representation of errors in the CB15 genome sequence and polymorphism between CB15 and NA1000. Caulobacter crescentus CB15 genome sequence (GenBank accession number AE005673) was aligned with the NA1000 sequence (accession number CP001340), and all differences identified were resequenced in both CB15 and NA1000. (A) Of the 76 differences identified, 20 were errors in the 454 sequence data (see Table S2 in the supplemental material) and 45 were errors in the published CB15 genome sequence, as both NA1000 and CB15 carry alleles identical to the newly generated NA1000 sequence (see Table S3 in the supplemental material). (B) The remaining 11 polymorphisms represent the true genotypic differences between CB15 and NA1000. They are numbered sequentially starting at the origin of replication (ori) and proceeding clockwise through the terminus (ter) and back to the origin. Figures were drawn with assistance from the Genome Tools Project software package (24). Sequencing statistics and details about sequence errors and polymorphisms are listed in Table 2 and Tables S1, S2, and S3 in the supplemental material.
FIG. 4.
FIG. 4.
The large indel in the NA1000 genome is a mobile element. (A) Analysis of the base composition of the NA1000 genome using a 1,000-bp sliding window reveals a substantially reduced GC content in the large indel, suggesting that it was acquired by horizontal transfer. Two other regions with known differences from average NA1000 GC content correspond to rRNA and tRNA loci. (B) The large indel is inserted into the 3′ end of serine tRNA gene CCNA_R0007 (long white arrow), causing a short duplication (short white arrows) but preserving the integrity of the gene. Four primers (A, B, C, and D; small black arrows) were used to determine if a strain carries the mobile element. Primer sets AB and CD amplify fragments spanning the left and right junctions, respectively. (C) Primer set AD fails to amplify a product in strains carrying the insertion but readily amplifies a product across the repaired junction. (D) Many mobile elements excise through a circular intermediate (8); the presence of a circular intermediate in NA1000 can be assayed with primer set BC. (E) Spontaneous deletion of this element occurs at low levels in exponentially growing NA1000 cultures. The only product amplified from a CB15 culture is the repaired junction (AD), whereas both the left and right junctions (AB and CD, respectively) are amplified from NA1000. A faint repaired junction (AD) product is detected in NA1000 cultures, suggesting that a small fraction of the cells in the population carry spontaneous deletions of the large indel. The AD products are identical in size and sequence in CB15, NA1000, and NA1000Δφ, indicating that deletion of this region is highly reproducible. We were unable to identify conditions that induced or enhanced excision and did not detect a circular intermediate with primers CB, suggesting that spontaneous excision events are rare, the intermediates are unstable, or excision of this element occurs via an alternate mechanism.
FIG. 5.
FIG. 5.
Simultaneous mapping of laboratory-evolved Caulobacter phenotypes by comparison of allele replacement strains with their parental backgrounds (Fig. 1 and Table 1). Strains are organized by background (CB15, left; NA1000, right), CB15 (white) and NA1000 (black) phenotypes are shown for reference, and strains that differ significantly from their parent are indicated (*, CB15; **, NA1000) (Table 4). The SNP numbers at the top and bottom apply to all graphs and tables. The capacity of cultures to be physically synchronized (A), their development of mucoid colony morphology on high-sugar media (M, mucoid; R, rough nonmucoid) (B), and their φCR30 susceptibility (C, clear plaques; T, turbid plaques) (C) map to the presence of the large indel (φ and the yellow bar in panel A and the yellow letters in panels B and C). (D) The difference in adhesion between NA1000 and CB15, as measured by a crystal violet assay, maps to SNP7, a frameshift mutation in the holdfast synthesis gene hfsA. (E) Increased survival in stationary phase is conferred by the presence of CB15 alleles at SNP8 and SNP10, a frameshift mutation and a single amino acid change, respectively, in two different TBDRs. Single-allele-replacement strains have intermediate survival rates (red and pink bars), while the double-allele-replacement strains show parental levels of survival (striped red and pink bars). (F) The faster generation time in NA1000 maps to SNP5 (green bars). All error bars are ±SEM.
FIG. 6.
FIG. 6.
Regulatory mutations that reduce zwf expression increase the growth rate of Caulobacter. (A) SNP5 is located 7 bp upstream of the zwf transcriptional start site in isolate NA1000 (Crosson1). An independently evolved allele (SNP5b) in NA1000 (Smit) is located 3 bp downstream of the zwf transcriptional start. (B) Both NA1000 promoters show reduced activity relative to those of CB15, as measured using transcriptional fusions to lacZ (one-way analysis of variance; P < 0.0001). (C) Model of carbon flux in CB15 cells (white arrows) and NA1000 cells (black arrows). Glucose (G) is phosphorylated to glucose-6-phosphate (G6P), which serves as the primary substrate for three metabolic pathways in Caulobacter. G6P can enter either the pentose phosphate (PP) or the Entner-Doudoroff (ED) pathway following dehydrogenation by the gene product of zwf, glucose-6-phosphate 1-dehydrogenase. Alternatively, G6P can be isomerized to fructose-6-phosphate (F6P) by glucose-6-phosphate isomerase. As dehydrogenation of G6P is the rate-limiting step in both the PP and ED pathways, reduced zwf expression is known to increase the amount of G6P available for isomerization into F6P and, consequently, increase the concentration of substrates used for cell membrane and cell wall biogenesis (29).

References

    1. Ackermann, M., A. Schauerte, S. C. Stearns, and U. Jenal. 2007. Experimental evolution of aging in a bacterium. BMC Evol. Biol. 7:126. - PMC - PubMed
    1. Artamonova, V. S., and A. A. Makhrov. 2006. Unintentional genetic processes in artificially maintained populations: proving the leading role of selection in evolution. Russ. J. Genet. 42:234-246. - PubMed
    1. Barrick, J. E., D. S. Yu, S. H. Yoon, H. Jeong, T. K. Oh, D. Schneider, R. E. Lenski, and J. F. Kim. 2009. Genome evolution and adaptation in a long-term experiment with Escherichia coli. Nature 461:1243-1247. - PubMed
    1. Boras, J. A., M. M. Sala, E. Vazquez-Dominguez, M. G. Weinbauer, and D. Vaque. 2009. Annual changes of bacterial mortality due to viruses and protists in an oligotrophic coastal environment (NW Mediterranean). Environ. Microbiol. 11:1181-1193. - PubMed
    1. Buckling, A., R. C. Maclean, M. A. Brockhurst, and N. Colegrave. 2009. The beagle in a bottle. Nature 457:824-829. - PubMed

Publication types

MeSH terms

Substances

Associated data

LinkOut - more resources