. 2010 May;22(5):1425-40.
doi: 10.1105/tpc.110.074682. Epub 2010 May 14.

cis-Regulatory elements and chromatin state coordinately control temporal and spatial expression of FLOWERING LOCUS T in Arabidopsis

Affiliations

cis-Regulatory elements and chromatin state coordinately control temporal and spatial expression of FLOWERING LOCUS T in Arabidopsis

Jessika Adrian et al. Plant Cell. 2010 May.

Abstract

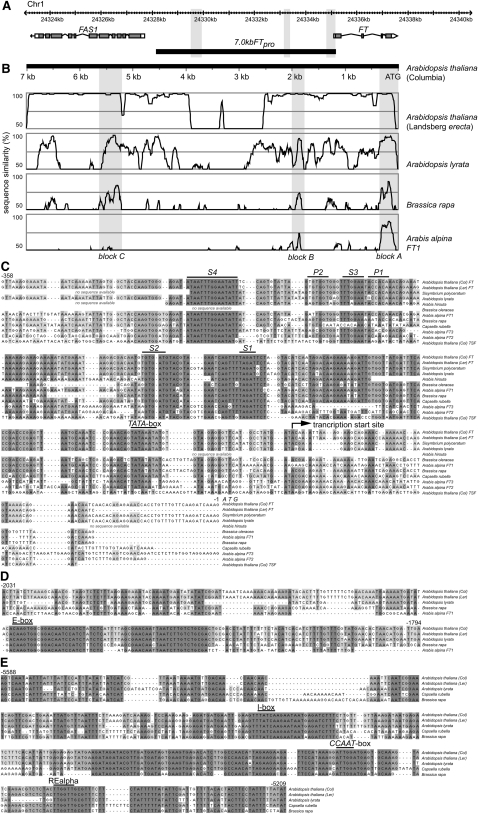
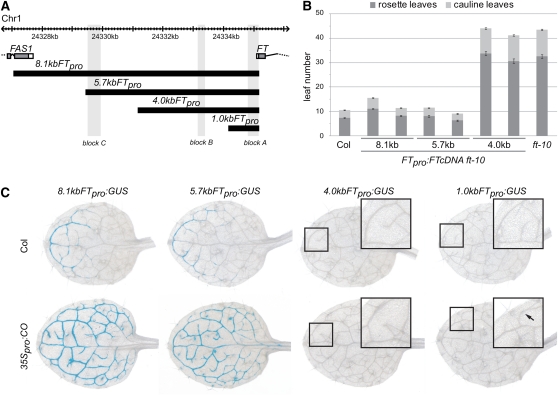
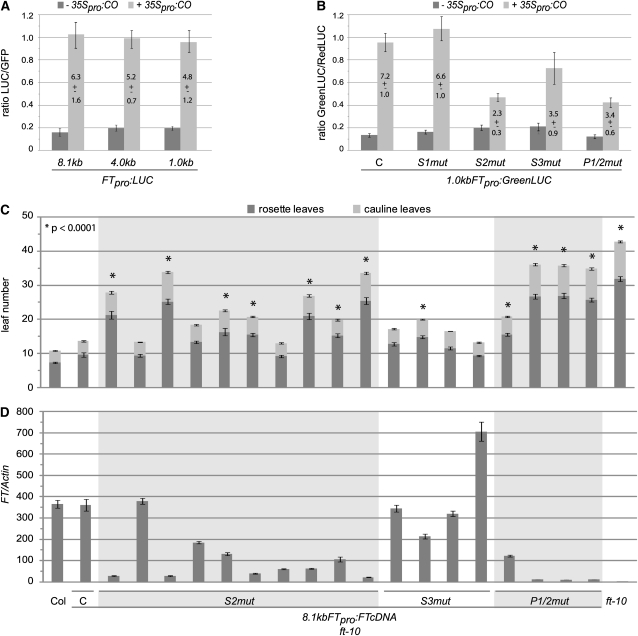
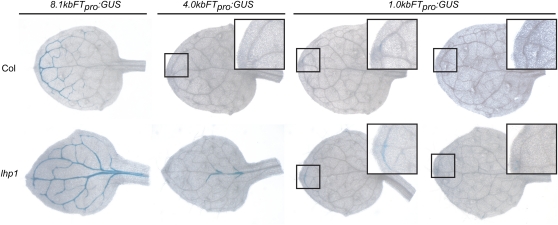
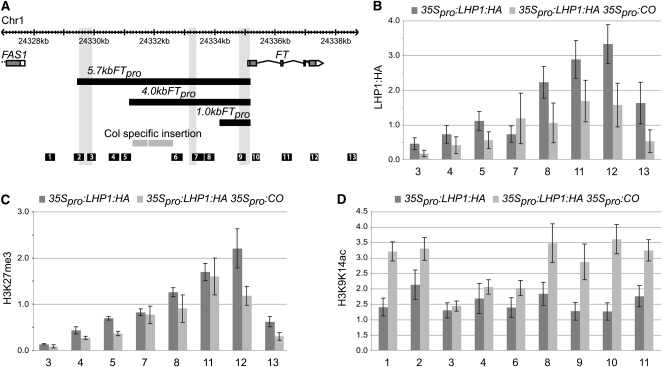
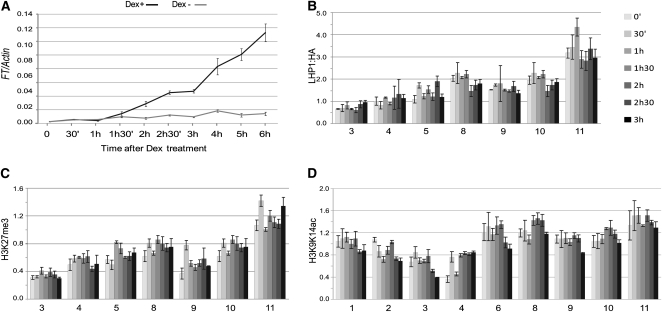
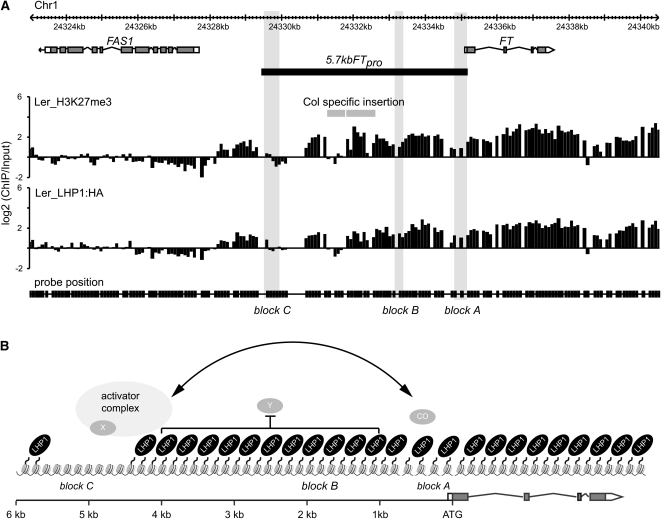
Flowering time of summer annual Arabidopsis thaliana accessions is largely determined by the timing of FLOWERING LOCUS T (FT) expression in the leaf vasculature. To understand the complex interplay between activating and repressive inputs controlling flowering through FT, cis-regulatory sequences of FT were identified in this study. A proximal and an approximately 5-kb upstream promoter region containing highly conserved sequence blocks were found to be essential for FT activation by CONSTANS (CO). Chromatin-associated protein complexes add another layer to FT regulation. In plants constitutively overexpressing CO, changes in chromatin status, such as a decrease in binding of LIKE HETEROCHROMATIN PROTEIN1 (LHP1) and increased acetylation of H3K9 and K14, were observed throughout the FT locus, although these changes appear to be a consequence of FT upregulation and not a prerequisite for activation. Binding of LHP1 was required to repress enhancer elements located between the CO-controlled regions. By contrast, the distal and proximal promoter sequences required for FT activation coincide with locally LHP1 and H3K27me3 depleted chromatin, indicating that chromatin status facilitates the accessibility of transcription factors to FT. Therefore, distant regulatory regions are required for FT transcription, reflecting the complexity of its control and differences in chromatin status delimit functionally important cis-regulatory regions.


Figures

Figure 1.
Figure 1.
Conservation of FT Promoter Sequences. (A) Genome browser view of the FT locus on chromosome 1 in A. thaliana accession Col. Exons of FT and the flanking gene FAS1 are represented as gray boxes and untranslated regions as white boxes. Arrows indicate the direction of transcription. The promoter sequence used for pairwise alignment is represented by a black box. Light-gray areas highlight the conserved regions block A, block B, and block C. (B) Pairwise alignment of FT promoter sequences from different species to 7.0-kb FT promoter sequence of A. thaliana Col using mVISTA (see Supplemental Data Sets 1 to 4 online). Graphical output shows basepair identity in a sliding window of 75 bp in a range of 50 to 100%. Light-gray areas highlight conserved blocks that were further analyzed with ClustalW2. Several other minor peaks observed with mVISTA were caused by general AT richness of the underlying sequence. (C) Sequence alignment of the proximal FT promoter (−1 to −358 bp, block A). Four conserved sequence stretches were identified and called shadow 1 to 4 (S1 to S4). A palindromic sequence flanking S3 is labeled as P1 and P2. Furthermore, the putative TATA box and the transcription start site are indicated. (D) Alignment of a region with high conservation (−1794 to −2031 bp), named block B. Block B shows two highly conserved sequence stretches, and a conserved E-box is indicated. (E) Sequence alignment of a distal FT promoter region (−5209 to −5588 bp), named block C. Predicted conserved CCAAT-box, a GATAA motif, called I-box, and a REalpha consensus sequence (AACCAA) are indicated. Multiple alignments were obtained with ClustalW2 (see Supplemental Data Set 5 online). Intensity of the shading corresponds to the degree of conservation.
Figure 2.
Figure 2.
CO-Mediated Induction of FT Requires Sequences between 4.0 and 5.7 kb Upstream of the FT Gene. (A) Genome browser view of the FT upstream sequences. Promoter constructs used for analyses are depicted as black boxes. (B) Flowering time of ft-10 plants carrying transgenic constructs driving FT cDNA by an 8.1-, 5.7-, and 4.0-kb FT promoter fragment. Two independent transgenic lines are shown for each construct; wild-type plants and ft-10 mutants were analyzed as control. Plants were grown under inductive ESD conditions. The experiment was repeated twice with similar results. Number of rosette and cauline leaves of a representative example are shown as the mean ± se. (C) Histochemical localization of GUS activity in first true leaves of 8.1kbFTpro:GUS, 5.7kbFTpro:GUS, 4.0kbFTpro:GUS, and 1.0kbFTpro:GUS plants. Transgenic plants in Col and 35Spro:CO background were grown for 10 LDs on soil. Insets show a higher magnification of an area of the distal half of the leaves. Arrow indicates a single GUS-stained phloem cell.
Figure 3.
Figure 3.
Proximal FT Promoter Sequences Are Crucial for Mediating Daylength Response. (A) A transient expression assay was performed using a luciferase gene (LUC) under control of FT promoter fragments of 8.1, 4.0, and 1.0 kb in length. CO-dependent transcriptional activation was analyzed by cobombardment of 35Spro:CO. Light emission per leaf was normalized to the fluorescence signal obtained from a cobombardment of the 35Spro:GFP construct. Fold stimulation of the promoter by CO is indicated within the light-gray bar for each construct. Data from three independent experiments are shown as mean ± se. (B) The 1.0kbFTpro:GreenLUC constructs carrying mutations in different putative cis-elements of the promoter were tested in a transient expression assay. Resulting green light emission was normalized to light emission of a cobombarded red light emitting luciferase (RedLUC). CO-dependent transcriptional activation was analyzed by cobombardment of 35Spro:CO. Fold stimulation of the promoter by CO is indicated within the light-gray bar for each construct. Mean ± se is based on at least three independent experiments. (C) Flowering time of ft-10 plants carrying transgenic constructs driving FT cDNA by mutated versions of the 8.1-kb FT promoter fragment. Several independent transformants are shown for each construct; wild-type plants, 8.1kbFTpro:FTcDNA ft-10 carrying no mutation (labeled as C in the graph), and ft-10 mutants were analyzed as controls. Plants were grown in ESD conditions. The experiment was repeated two times with similar results. Differences in total leaf number compared with 8.1kbFTpro:FTcDNA ft-10 plants were analyzed with a two-way analysis of variance. Asterisks indicate significant differences with P values < 0.0001. Number of rosette and cauline leaves of a representative experiment are shown as the mean ± se. (D) Quantitative PCR of FT expression in ft-10 seedlings carrying nonmutated and mutated versions of the 8.1kbFTpro:FTcDNA transgene. Plant material was harvested at ZT 16 on day 10 under ESD conditions. Molarity of mRNA (pmol) was calculated and normalized by Actin (pmol). Error bars represent se of the mean based on three technical replicates.
Figure 4.
Figure 4.
LHP1 Mediates FT Transcriptional Regulation through 4.0-kb FT Promoter Region. Spatial GUS expression pattern in first true leaves of 8.1kbFTpro:GUS, 4.0kbFTpro:GUS, and 1.0kbFTpro:GUS plants grown for 10 LDs on agar. Transgenic plants in Col and lhp1 background are based on independent transformations. Insets show a higher magnification of an area of the distal half of the leaves.
Figure 5.
Figure 5.
Chromatin Changes in Highly FT Transcribed Conditions. (A) Genome browser view of the FT locus as shown before. Two Col-specific insertions that are not present in Ler are depicted in gray. Positions of amplicons used in the ChIP analysis are presented as black boxes and are numbered. (B) Binding of LHP1 at the FT locus. ChIP experiments were performed with chromatin from 35Spro:LHP1:HA and 35Spro:LHP1:HA 35Spro:CO Ler plants grown for 10 d under sd conditions. Signals detected along the FT locus were normalized with the signal obtained for At4g24640, which is not under the regulation of CO but is a LHP1 target. (C) Trimethylation of H3K27 at FT in 35Spro:CO plants. Data are based on the same chromatin extract and analysis as used in (B). (D) Acetylation of H3K9 and K14 in the promoter and the transcribed region of FT in seedlings ubiquitously expressing CO. The experiment is based on the same chromatin extract as used in (B). Data were normalized using the highly transcribed At1g67090. Data in (B) to (D) are shown as the mean of a representative experiment. Error bars show the 95% confidence interval of three technical replicates.
Figure 6.
Figure 6.
Chromatin Changes at the FT Locus upon Early FT Induction. (A) Temporal FT expression upon CO induction. 35Spro:LHP1:HA 35Spro:CO:GR Ler seedlings were grown under noninductive sd conditions. At day 10, plant material was harvested every 30 min after Dex (Dex+) or mock (Dex−) treatment. Expression levels of FT mRNA were normalized by Actin. Data are shown as the mean of a representative experiment. Data are based on three technical replicates. Error bars show the sd of three technical replicates. (B) Binding pattern of LHP1 to the FT locus upon induction of FT transcription. ChIP experiments were performed with chromatin from samples taken before (time point 0) and every 30 min after Dex treatment for 3 h. Positions of amplicons used in the ChIP analysis are shown in Figure 5A. Data were normalized as in Figure 5B and are shown as the mean of a representative experiment. (C) Signals for the histone mark H3K27me3 in Dex-treated 35Spro:CO:GR plants. Data are based on the same chromatin extract and analysis as used in (B). (D) H3K9K14ac signals along the FT locus before and after FT induction. The experiment is based on the same chromatin extract as used in (B). Signals were normalized as in Figure 5D. Data in (B) to (D) are shown as the mean of a representative experiment. Error bars show the 95% confidence interval of three technical replicates.
Figure 7.
Figure 7.
A Model of FT Transcriptional Activation Mediated through Interaction of Two Conserved and LHP1-Depleted Regions. (A) Schematic diagram of the distribution of H3K27me3 chromatin mark and LHP1:HA protein in 35Spro:LHP1:HA Ler plants. ChIP-chip material was generated from 10-d-old seedlings grown on GM medium under LD conditions. Enrichment was calculated as the log2 ratio of ChIP sample versus input sample. Two Col-specific insertions that are not present in Ler are depicted in gray. Light-gray areas highlight the conserved blocks upstream of FT. (B) The model shows a constitutively LHP1 poor region that coincides with block C and might enable accessibility of transcription factors required for CO-dependent activation of FT. This interaction of CO with a protein partner or an activator complex might enhance CO binding DNA affinity to block A located in the proximal promoter. The middle part of the promoter contains response elements for one or several unknown activating factors “Y,” which are specifically expressed in the midvein. The middle part of the promoter is accessible after a prolonged high expression of FT or when LHP1 is genetically deleted.

Comment in

References

    1. Abe M., Kobayashi Y., Yamamoto S., Daimon Y., Yamaguchi A., Ikeda Y., Ichinoki H., Notaguchi M., Goto K., Araki T. (2005). FD, a bZIP protein mediating signals from the floral pathway integrator FT at the shoot apex. Science 309: 1052–1056 - PubMed
    1. Aukerman M.J., Sakai H. (2003). Regulation of flowering time and floral organ identity by a microRNA and its APETALA2-like target genes. Plant Cell 15: 2730–2741 - PMC - PubMed
    1. Ben-Naim O., Parnis R.E.A., Teper-Bamnolker P., Shalit A., Coupland G., Samach A., Lifschitz E. (2006). The CCAAT binding factor can mediate interactions between CONSTANS-like proteins and DNA. Plant J. 46: 462–476 - PubMed
    1. Bradley D., Ratcliffe O., Vincent C., Carpenter R., Coen E. (1997). Inflorescence commitment and architecture in Arabidopsis. Science 275: 80–83 - PubMed
    1. Brudno M., Malde S., Poliakov A., Do C.B., Couronne O., Dubchak I., Batzoglou S. (2003). Glocal alignment: Finding rearrangements during alignment. Bioinformatics 19: i54–i62 - PubMed

Publication types

MeSH terms

LinkOut - more resources