. 2010 Aug 26;116(8):1291-8.
doi: 10.1182/blood-2010-01-265975. Epub 2010 May 14.

B7-H1/CD80 interaction is required for the induction and maintenance of peripheral T-cell tolerance

Affiliations

B7-H1/CD80 interaction is required for the induction and maintenance of peripheral T-cell tolerance

Jang-June Park et al. Blood. .

Abstract

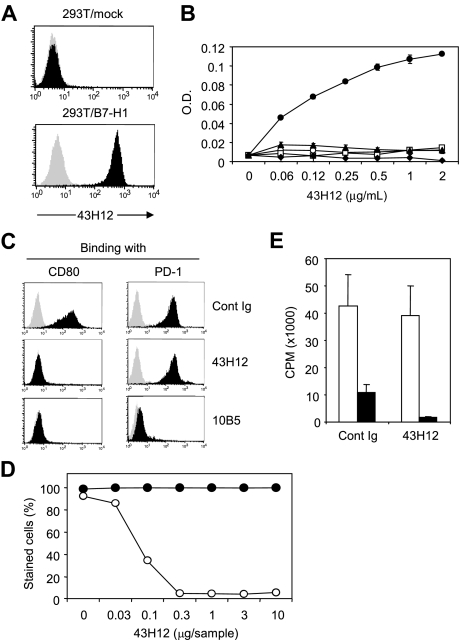
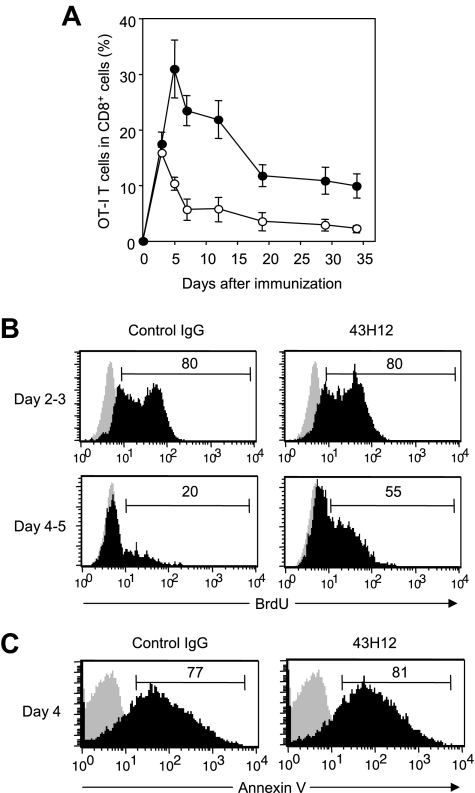
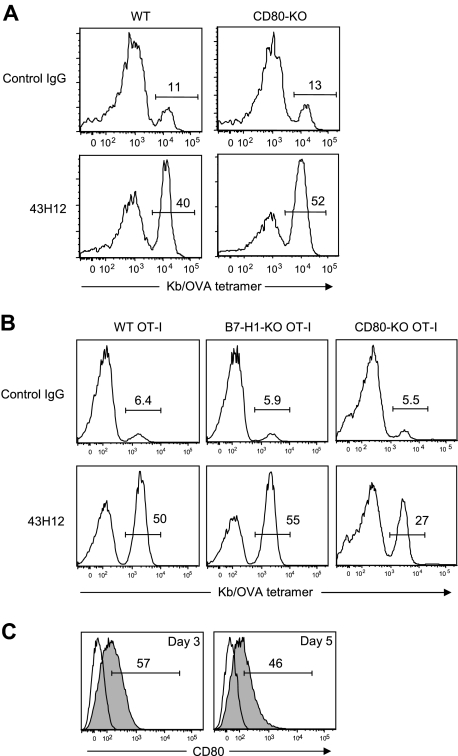
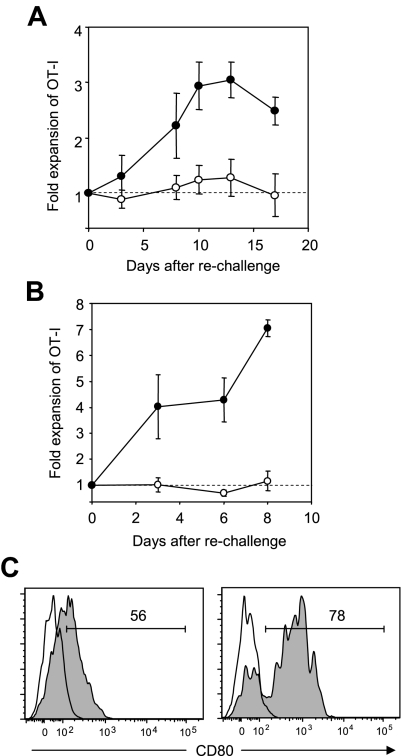
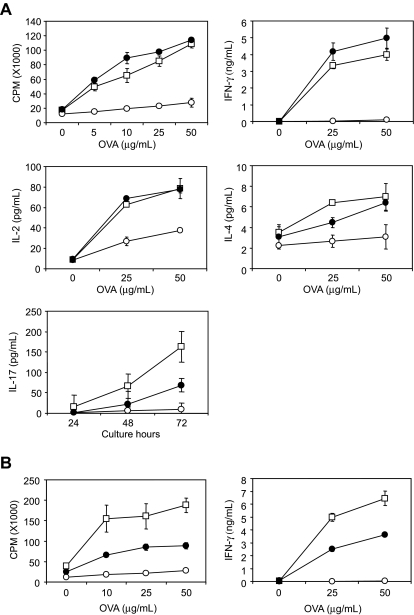
T-cell tolerance is the central program that prevents harmful immune responses against self-antigens, in which inhibitory PD-1 signal given by B7-H1 interaction plays an important role. Recent studies demonstrated that B7-H1 binds CD80 besides PD-1, and B7-H1/CD80 interaction also delivers inhibitory signals in T cells. However, a role of B7-H1/CD80 signals in regulation of T-cell tolerance has yet to be explored. We report here that attenuation of B7-H1/CD80 signals by treatment with anti-B7-H1 monoclonal antibody, which specifically blocks B7-H1/CD80 but not B7-H1/PD-1, enhanced T-cell expansion and prevented T-cell anergy induction. In addition, B7-H1/CD80 blockade restored Ag responsiveness in the previously anergized T cells. Experiments using B7-H1 or CD80-deficient T cells indicated that an inhibitory signal through CD80, but not B7-H1, on T cells is responsible in part for these effects. Consistently, CD80 expression was detected on anergic T cells and further up-regulated when they were re-exposed to the antigen (Ag). Finally, blockade of B7-H1/CD80 interaction prevented oral tolerance induction and restored T-cell responsiveness to Ag previously tolerized by oral administration. Taken together, our findings demonstrate that the B7-H1/CD80 pathway is a crucial regulator in the induction and maintenance of T-cell tolerance.


Figures

Figure 1
Figure 1
Selective blockade of B7-H1/CD80 interaction by anti–B7-H1 mAbý clone 43H12. (A) 293T cells transfected with mock or mouse B7-H1–encoding plasmids were stained with 1 μg/mL anti–B7-H1 monoclonal antibody (mAb) clone 43H12 (black histogram) or control rat immunoglobulin (IgG; gray histogram) followed by fluorescein isothiocyanate (FITC)–conjugated anti–rat IgG. Binding of 43H12 to B7-H1 was analyzed by flow cytometry. (B) ELISA plate was coated with 2 μg/mL mouse B7-H1-Fc (●), mouse CD80-Fc (○), mouse B7-DC-Fc (□), mouse B7-H3-Fc (▴), or mouse B7-H4-Fc (♦) fusion proteins. Indicated doses of 43H12 were added into wells and its binding with the coated proteins were detected by horseradish peroxidase (HRP)–conjugated anti–rat IgG antobody (Ab). Average ± SD of optical density (O.D.) from triplicate wells are shown. (C) 293T cells transfected with plasmids encoding mock (gray histogram) or B7-H1 (black histogram) were incubated with 2 μg/mL biotin-conjugated CD80-Fc (left panels) or PD-1-Fc (right panels) fusion proteins in the presence of 2 μg/mL 43H12, 10B5, or control rat IgG. The staining of fusion proteins were detected by streptavidin-PE in flow cytometry. (D) 293T cells transfected with plasmids encoding B7-H1 were stained with CD80-Fc (○) or PD-1-Fc (●) fusion proteins in the presence of indicated doses of 43H12. Percentage of positively stained cells was assessed by flow cytometry. (E) T cells isolated from CD80-knockout (KO) mice were stimulated with anti-CD3 mAb together with immobilized B7-H1-Fc (■) or control human Fc (□) in the presence of soluble 43H12 or control rat IgG. Proliferation of the culture cells were assessed by 3H-thymidine incorporation. All experiments were repeated at least 3 times and representative data are shown.
Figure 2
Figure 2
Enhanced expansion of Ag-reactive CD8+ T cells by blockade of B7-H1/CD80 interaction. B6 mice were transferred intravenously with OTA-specific CD8 (OT-I) T cells and injected intravenously with 0.5 mg of OVA257-264 peptide. On day of peptide injection and 3 days later, the mice were treated intraperitoneally with 200 μg of 43H12 or control rat IgG. (A) PBMCs were harvested at the indicated time points, and a percentage of OT-I T cells in total CD8-positive cells was assessed in the 43H12-treated (●) or control IgG-treated (○) mice by flow cytometry. The data are shown as mean ± SEM. (B) Mice were given 100 μg of BrdU intraperitoneally on day 2 (top panels) or day 4 (bottom panels) after OVA peptide injection. Twenty-four hours after BrdU injection, spleen cells were harvested and BrdU incorporation in CD8/OVA-tetramer double-positive OT-I T cells was analyzed by flow cytometry (black histogram). As background level, OT-I T cells in the mice without BrdU administration were stained similarly (gray histogram). (C) Spleen cells were harvested 4 days after OVA peptide injection and annexin V staining in CD8/OVA-tetramer double-positive OT-I T cells was analyzed by flow cytometry (black histogram). Background level without annexin V staining is also shown (gray histogram). All experiments were independently repeated at least 3 times, and the representative data are shown. The numbers in the histogram indicate the percentage of positively stained cells.
Figure 3
Figure 3
A role of T cell–associated CD80 in the inhibitory effects of B7-H1/CD80 interaction. (A) WT B6 mice or CD80-KO mice were transferred intravenously with OT-I T cells. In panel B, B6 mice were transferred intravenously with WT, B7-H1-KO, or CD80-KO background OT-I T cells. In both settings, the recipient mice were injected intravenously with 0.5 mg of OVA257-264 peptide, and treated intraperitoneally with 200 μg of 43H12 or control rat IgG on day of peptide injection and 3 days later. Splenocytes were harvested 5 days after peptide injection, and the percentage of OT-I T cells in CD8-positive population was assessed by flow cytometry. (C) B6 mice were transferred intravenously with OT-I T cells and injected intravenously with 0.5 mg of OVA257-264 peptide. On day 3 and day 5, CD8/OVA-tetramer double-positive OT-I T cells was stained with anti-CD80 mAb and analyzed by flow cytometry (gray histogram). Nonstained background levels of the same cells are also shown (open histogram). All experiments were repeated at least 3 times, and the representative data are shown. The numbers in the histogram indicate the percentage of positively stained cells.
Figure 4
Figure 4
Prevention and restoration of CD8+ T-cell anergy by blockade of B7-H1/CD80 interaction. B6 mice were transferred intravenously with OT-I T cells and injected intravenously with 0.5 mg of OVA257-264 peptide. (A) On day of peptide injection and 3 days later, the mice were treated intraperitoneally with 200 μg of 43H12 (●) or control rat IgG (○). Thirty-four days after initial peptide injection, the mice were rechallenged intravenously with 0.5 mg of OVA257-264 peptide, and percentages of CD8/OVA-tetramer double-positive OT-I T cells in PBMCs were assessed by flow cytometry at the indicated time points. Fold expansion of OT-I T cells was calculated by dividing OT-I T-cell percentages after rechallenge by that before rechallenge in individual mice. (B) Twenty days after the initial OVA peptide injection, the mice were rechallenged with 0.5 mg of OVA257-264 peptide and treated intraperitoneally with 200 μg of 43H12 (●) or control rat IgG (○) on day of peptide rechallenge and 3 days later. Fold expansion of OT-I T cells in PBMC was assessed as in panel A at the indicated time points. (C) Twenty days after the initial OVA peptide injection, the mice were left untreated (left panel) or rechallenged with 0.5 mg of OVA257-264 peptide (right panel). Twenty-four hours later, CD8/OVA-tetramer double-positive OT-I T cells in the spleen were stained with anti-CD80 mAb and analyzed by flow cytometry (gray histogram). Nonstained background levels of the same cells are also shown (open histogram). All experiments were repeated at least 3 times and the representative data are shown. The numbers in the histogram indicate the percentage of positively stained cells.
Figure 5
Figure 5
Prevention and restoration of oral tolerance by blockade of B7-H1/CD80 interaction. B6 mice were given drinking water supplemented with OVA protein (○ or ●) or without OVA (□) from day 0 to day 7. On day 14, the mice were immunized subcutaneously with OVA protein emulsified in CFA. The mice were also treated intraperitoneally with 150 μg of 43H12 (●) or control rat IgG (○) on days 0, 4, 8, and 12 (A) or on days 14 and 17 (B). On day 21, draining LN cells were harvested from the mice and cultured with the indicated doses of OVA protein. After 48 hours, production of IFN-γ, IL-2, and IL-4 in culture supernatant was measured by ELISA. IL-17 level was measured 24, 48, and 72 hours after culture with 25 μg/mL OVA protein. Proliferative activity was assessed by an incorporation of 3H-thymidine. All experiments were repeated at least 3 times. Representative data are shown as mean ± SD of triplicate wells in each group.

References

    1. Chen L. Co-inhibitory molecules of the B7-CD28 family in the control of T-cell immunity. Nat Rev Immunol. 2004;4(5):336–347. - PubMed
    1. Dong H, Zhu G, Tamada K, et al. B7-H1 determines accumulation and deletion of intrahepatic CD8(+) T lymphocytes. Immunity. 2004;20(3):327–336. - PubMed
    1. Latchman YE, Liang SC, Wu Y, et al. PD-L1-deficient mice show that PD-L1 on T cells, antigen-presenting cells, and host tissues negatively regulates T cells. Proc Natl Acad Sci U S A. 2004;101(29):10691–10696. - PMC - PubMed
    1. Zhu B, Guleria I, Khosroshahi A, et al. Differential role of programmed death-ligand 1 [corrected] and programmed death-ligand 2 [corrected] in regulating the susceptibility and chronic progression of experimental autoimmune encephalomyelitis. J Immunol. 2006;176(6):3480–3489. - PubMed
    1. Reynoso ED, Elpek KG, Francisco L, et al. Intestinal tolerance is converted to autoimmune enteritis upon PD-1 ligand blockade. J Immunol. 2009;182(4):2102–2112. - PMC - PubMed

Publication types

MeSH terms